MATLAB: An Introduction with Applications
6th Edition
ISBN: 9781119256830
Author: Amos Gilat
Publisher: John Wiley & Sons Inc
expand_more
expand_more
format_list_bulleted
Concept explainers
Question

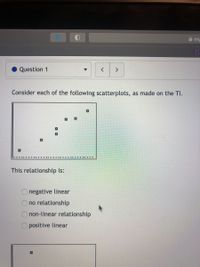
Transcribed Image Text:A my
Question 1
Consider each of the following scatterplots, as made on the TI.
This relationship is:
negative linear
no relationship
non-linear relationship
O positive linear
O O

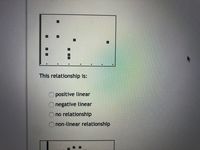
Transcribed Image Text:This relationship is:
positive linear
negative linear
no relationship
onon-linear relationship
O 0O
O O O O
Expert Solution
This question has been solved!
Explore an expertly crafted, step-by-step solution for a thorough understanding of key concepts.
This is a popular solution
Trending nowThis is a popular solution!
Step by stepSolved in 2 steps with 2 images

Knowledge Booster
Learn more about
Need a deep-dive on the concept behind this application? Look no further. Learn more about this topic, statistics and related others by exploring similar questions and additional content below.Similar questions
- Create a histogram for each set of data. For the first two problems, the frame is set up for you. For #3, YOU will need to determine the best ways to number the axes. Don't forget to include a title as well! Daily high temperature in degrees Fahrenheit: 63 70 64 71 70 62 68 67 68 72 65 62 59 58 60 59 56 53 51 55 56 50 53 57 55 50 46 49 46 52 48 Frequency Table: Interval # of values 40-44 45-49 50-54 55-59 60-64 65-69 70-74 2. Test scores, out of 100 points 92 84 95 77 74 80 95 70 66 73 68 90 78 64 72 78 76 65 59 71 77 92 91 89 74 76 90arrow_forwardQUESTION 12 Determine which type of chart is the most appropriate representation for the following data : The data represents the percentage of time that Shaikha devotes to studying her five courses in ZU. Histogram Line Chart Dot Plot O Pie Chartarrow_forwardI need help with only question 14. I need help with parts a,b,c,d, and e.arrow_forward
- A population data set produced the following information. N= 40. Σx= 1080, Σν= 2430, Σw= 26,930 Σ47.870, and Σy 38,772 Find the values of oe and p?. Round oe to four decimal places and p to three decimal places.arrow_forwardQuestion 19 Which of the categories on this membership card represent quantitative data? A Sports Club Name: Age: Sport: Membership no.: A) Age and membership number B) Name, sport, and membership number C) Name and sport D) Age mat Tools Table D2arrow_forwardONLY QUESTION 5 COMPLETE THAN REATING HELPFULarrow_forward
- Question 3 Directions: Make a scatter plot using the data, and then draw a line of best fit that seems to represent the data. The Life Expectancy values for people born in the United States of America are given in the chart. Year Born 1900 1910 1920 1930 Life Expectancy 47.3 50 54.1 59.7 Year Born 1940 1950 1960 1970 Life Expectancy 62.9 68.2 69.7 70.8 © Kelly McCownarrow_forwardAn insurance investigator has observed that people with some astrological signs tend to be safer drivers than people with other signs. Using insurance records, the investigator classified 150 people according to their astrological signs and whether or not they were involved in a car accident during the previous 12 months. Do the following data indicate a significant relationship between sign and accidents? Test with a = .05. Libra Leo Gemini Accident 7 4 19 No Accident 73 46 1arrow_forwardNext question Use the following cell phone airport data speeds (Mbps) from a particular network. Find Q1 0.1 0.2 0.3 0.3 0.3 0.4 0.6 0.6 0.6 0.7 O 0.8 0.8 0.8 0.8 0.9 0.9 1.1 1.2 1.2 1.3 1.8 1.8 2.1 2.1 2.5 2.6 2.7 2.7 3.9 3.9 4.2 4.9 57 6.4 7.3 7.5 7.8 8.2 8.7 9.4 10.1 10.4 11.5 12.4 13.1 13.4 14.7 14.8 14 9 27.7 Q1 = Mbps (Type an integer or a decimal. Do not round.)arrow_forward
- A random sample of 1000 households was taken and the dollar amount spent monthly on internet service was recorded for each. What is the wording in the context of this problem for the parameter u?arrow_forwardthe blank boxes are.. since most men meet or do not meet it is likely that most of the characters are women or menarrow_forwardCalculate the followingarrow_forward
arrow_back_ios
SEE MORE QUESTIONS
arrow_forward_ios
Recommended textbooks for you
 MATLAB: An Introduction with ApplicationsStatisticsISBN:9781119256830Author:Amos GilatPublisher:John Wiley & Sons Inc
 Probability and Statistics for Engineering and th...StatisticsISBN:9781305251809Author:Jay L. DevorePublisher:Cengage Learning
 Statistics for The Behavioral Sciences (MindTap C...StatisticsISBN:9781305504912Author:Frederick J Gravetter, Larry B. WallnauPublisher:Cengage Learning
 Elementary Statistics: Picturing the World (7th E...StatisticsISBN:9780134683416Author:Ron Larson, Betsy FarberPublisher:PEARSON
 The Basic Practice of StatisticsStatisticsISBN:9781319042578Author:David S. Moore, William I. Notz, Michael A. FlignerPublisher:W. H. Freeman
 Introduction to the Practice of StatisticsStatisticsISBN:9781319013387Author:David S. Moore, George P. McCabe, Bruce A. CraigPublisher:W. H. Freeman

MATLAB: An Introduction with Applications
Statistics
ISBN:9781119256830
Author:Amos Gilat
Publisher:John Wiley & Sons Inc

Probability and Statistics for Engineering and th...
Statistics
ISBN:9781305251809
Author:Jay L. Devore
Publisher:Cengage Learning

Statistics for The Behavioral Sciences (MindTap C...
Statistics
ISBN:9781305504912
Author:Frederick J Gravetter, Larry B. Wallnau
Publisher:Cengage Learning

Elementary Statistics: Picturing the World (7th E...
Statistics
ISBN:9780134683416
Author:Ron Larson, Betsy Farber
Publisher:PEARSON

The Basic Practice of Statistics
Statistics
ISBN:9781319042578
Author:David S. Moore, William I. Notz, Michael A. Fligner
Publisher:W. H. Freeman

Introduction to the Practice of Statistics
Statistics
ISBN:9781319013387
Author:David S. Moore, George P. McCabe, Bruce A. Craig
Publisher:W. H. Freeman