
MATLAB: An Introduction with Applications
6th Edition
ISBN: 9781119256830
Author: Amos Gilat
Publisher: John Wiley & Sons Inc
expand_more
expand_more
format_list_bulleted
Related questions
Concept explainers
Question
thumb_up100%
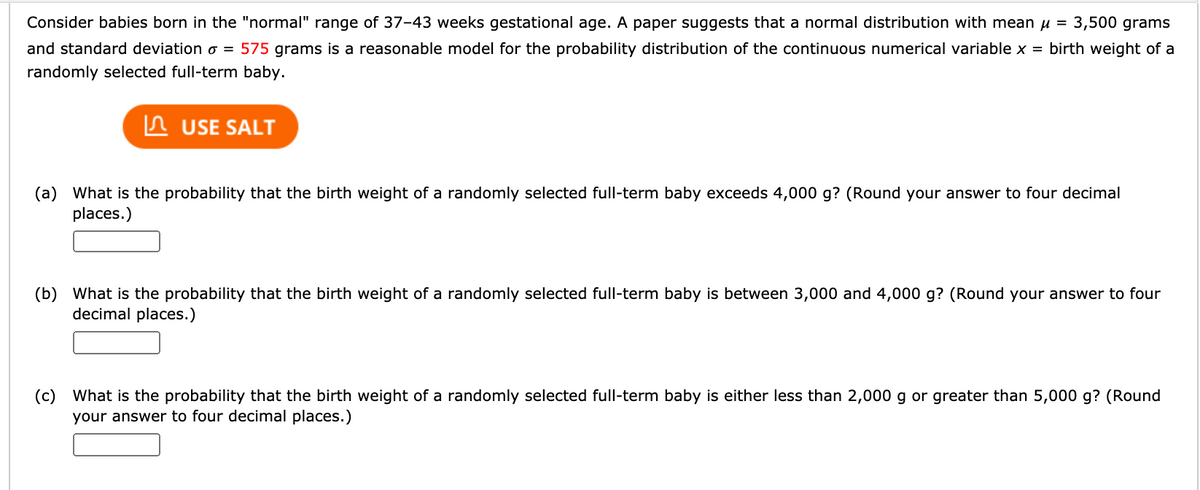

Transcribed Image Text:Consider babies born in the "normal" range of 37-43 weeks gestational age. A paper suggests that a normal distribution with mean u = 3,500 grams
and standard deviation o = 575 grams is a reasonable model for the probability distribution of the continuous numerical variable x = birth weight of a
randomly selected full-term baby.
n USE SALT
(a) What is the probability that the birth weight of a randomly selected full-term baby exceeds 4,000 g? (Round your answer to four decimal
places.)
(b) What is the probability that the birth weight of a randomly selected full-term baby is between 3,000 and 4,000 g? (Round your answer to four
decimal places.)
(c) What is the probability that the birth weight of a randomly selected full-term baby is either less than 2,000 g or greater than 5,000 g? (Round
your answer to four decimal places.)
Expert Solution
This question has been solved!
Explore an expertly crafted, step-by-step solution for a thorough understanding of key concepts.

This is a popular solution

Trending nowThis is a popular solution!

Step by stepSolved in 2 steps with 2 images

Knowledge Booster


Learn more about
Need a deep-dive on the concept behind this application? Look no further. Learn more about this topic, statistics and related others by exploring similar questions and additional content below.Similar questions
- The height of American men in feet is modeled with a normal distribution, with mean μ = 5.75 feet and variance o² = 0.333 feet. What is the probability that a randomly selected man's height is between 6 and 6.5 feet? Round to the nearest 4th decimal place, 0.xxxxarrow_forwardThe lengths of a particular animal's pregnancies are approximately normally distributed, with mean µ = 277 days and standard deviation o = 20 days. (a) What proportion of pregnancies lasts more than 302 days? (b) What proportion of pregnancies lasts between 252 and 287 days? (c) What is the probability that a randomly selected pregnancy lasts no more than 242 days?arrow_forwardThe lengths of a particular animal's pregnancies are approximately normally distributed, with mean µ=251 days and standard deviation o=8 days. (a) What proportion of pregnancies lasts more than 255 days? (b) What proportion of pregnancies lasts between 249 and 253 days? (c) What is the probability that a randomly selected pregnancy lasts no more than 241 days? (d) A "very preterm" baby is one whose gestation period is less than 231 days. Are very preterm babies unusual? Click the icon to view a table of areas under the normal curve. (a) The proportion of pregnancies that last more than 255 days is 0.3085 (Round to four decimal places as needed.) (b) The proportion of pregnancies that last between 249 and 253 days is 0.1974. (Round to four decimal places as needed.) ACCE (c) The probability that a randomly selected pregnancy lasts no more than 241 days is 0.1056 (Round to four decimal places as needed.) (d) A "very preterm" baby is one whose gestation period is less than days. Are very…arrow_forward
- The lengths of a particular animal's pregnancies are approximately normally distributed, with mean u 278 days and standard deviation o 16 days. (a) What proportion of pregnancies lasts more than 290 days? (b) What proportion of pregnancies lasts between 274 and 286 days? (c) What is the probability that a randomly selected pregnancy lasts no more than 258 days? (d) A "very preterm" baby is one whose gestation period is less than 254 days. Are very preterm babies unusual? (a) The proportion of pregnancies that last more than 290 days is (Round to four decimal places as needed.) (b) The proportion of pregnancies that last between 274 and 286 days is (Round to four decimal places as needed.) (c) The probability that a randomly selected pregnancy lasts no more than 258 days is (Round to four decimal places as needed.) (d) The probability of a "very preterm" baby is This event unusual because the probability is than 0.05 (Round to four decimal places as needed.) Enter your answer in each of…arrow_forwardThe physical fitness of an athlete is often measured by how much oxygen the athlete takes in (which is recorded in milliliters per kilogram, ml/kg). The mean maximum oxygen uptake for elite athletes has been found to be 65 with a standard deviation of 10. Assume that the distribution is approximately normal. (a) What is the probability that an elite athlete has a maximum oxygen uptake of at least 50 ml/kg? answer: (b) What is the probability that an elite athlete has a maximum oxygen uptake of 60 ml/kg or lower? answer: (c) Consider someone with a maximum oxygen uptake of 31 ml/kg. Is it likely that this person is an elite athlete? Write "YES" or "NO." answer:arrow_forward(b) A company has 16 cars of this model in its fleet. What is the probability that the average NOX + NMOG level x¯ of these cars is above 90 mg/mi? - life for one car model vary Normally with mean 84 mg/mi and standard deviation 6 mg/miarrow_forward
- Suppose the sediment density (g/cm) of a randomly selected specimen from a certain region is normally distributed with mean 2.63 and standard deviation 0.83. In USE SALT (a) If a random sample of 25 specimens is selected, what is the probability that the sample average sediment density is at most 3.00? Between 2.63 and 3.00? (Round your answers to four decimal places.) at most 3.00 between 2.63 and 3.00 (b) How large a sample size would be required to ensure that the first probability in part (a) is at least 0.99? (Round your answer up to the nearest whole number.) specimensarrow_forwardI. NORMAL PROBABILITY DISTRIBUTION Cars are passing through a checkpoint. Assume the speeds are normally distributed such that the mean (u) = 61 mph and the standard deviation (sigma) = 4 mph. а. b. Calculate the probability (area under the curve) that the next car to pass will be travelling more than 58 mph.arrow_forwardIt is reported that American adolescents spend an average of μ =4 hours per day using smart phone (σ = 2 hours). Assuming the distribution is normal, a. What is the probability of selecting an individual who uses a smart phone more than 8 hours a day? b. what proportion of American adolescents spend between 2.5 and 5.5 hours per day using smart phones?arrow_forward
arrow_back_ios
arrow_forward_ios
Recommended textbooks for you
- MATLAB: An Introduction with ApplicationsStatisticsISBN:9781119256830Author:Amos GilatPublisher:John Wiley & Sons Inc
 Probability and Statistics for Engineering and th...StatisticsISBN:9781305251809Author:Jay L. DevorePublisher:Cengage Learning
 Statistics for The Behavioral Sciences (MindTap C...StatisticsISBN:9781305504912Author:Frederick J Gravetter, Larry B. WallnauPublisher:Cengage Learning
  Elementary Statistics: Picturing the World (7th E...StatisticsISBN:9780134683416Author:Ron Larson, Betsy FarberPublisher:PEARSON
 The Basic Practice of StatisticsStatisticsISBN:9781319042578Author:David S. Moore, William I. Notz, Michael A. FlignerPublisher:W. H. Freeman
 Introduction to the Practice of StatisticsStatisticsISBN:9781319013387Author:David S. Moore, George P. McCabe, Bruce A. CraigPublisher:W. H. Freeman
MATLAB: An Introduction with Applications
Statistics
ISBN:9781119256830
Author:Amos Gilat
Publisher:John Wiley & Sons Inc
Probability and Statistics for Engineering and th...
Statistics
ISBN:9781305251809
Author:Jay L. Devore
Publisher:Cengage Learning
Statistics for The Behavioral Sciences (MindTap C...
Statistics
ISBN:9781305504912
Author:Frederick J Gravetter, Larry B. Wallnau
Publisher:Cengage Learning
Elementary Statistics: Picturing the World (7th E...
Statistics
ISBN:9780134683416
Author:Ron Larson, Betsy Farber
Publisher:PEARSON
The Basic Practice of Statistics
Statistics
ISBN:9781319042578
Author:David S. Moore, William I. Notz, Michael A. Fligner
Publisher:W. H. Freeman
Introduction to the Practice of Statistics
Statistics
ISBN:9781319013387
Author:David S. Moore, George P. McCabe, Bruce A. Craig
Publisher:W. H. Freeman