
ENGR.ECONOMIC ANALYSIS
14th Edition
ISBN: 9780190931919
Author: NEWNAN
Publisher: Oxford University Press
expand_more
expand_more
format_list_bulleted
Related questions
Question
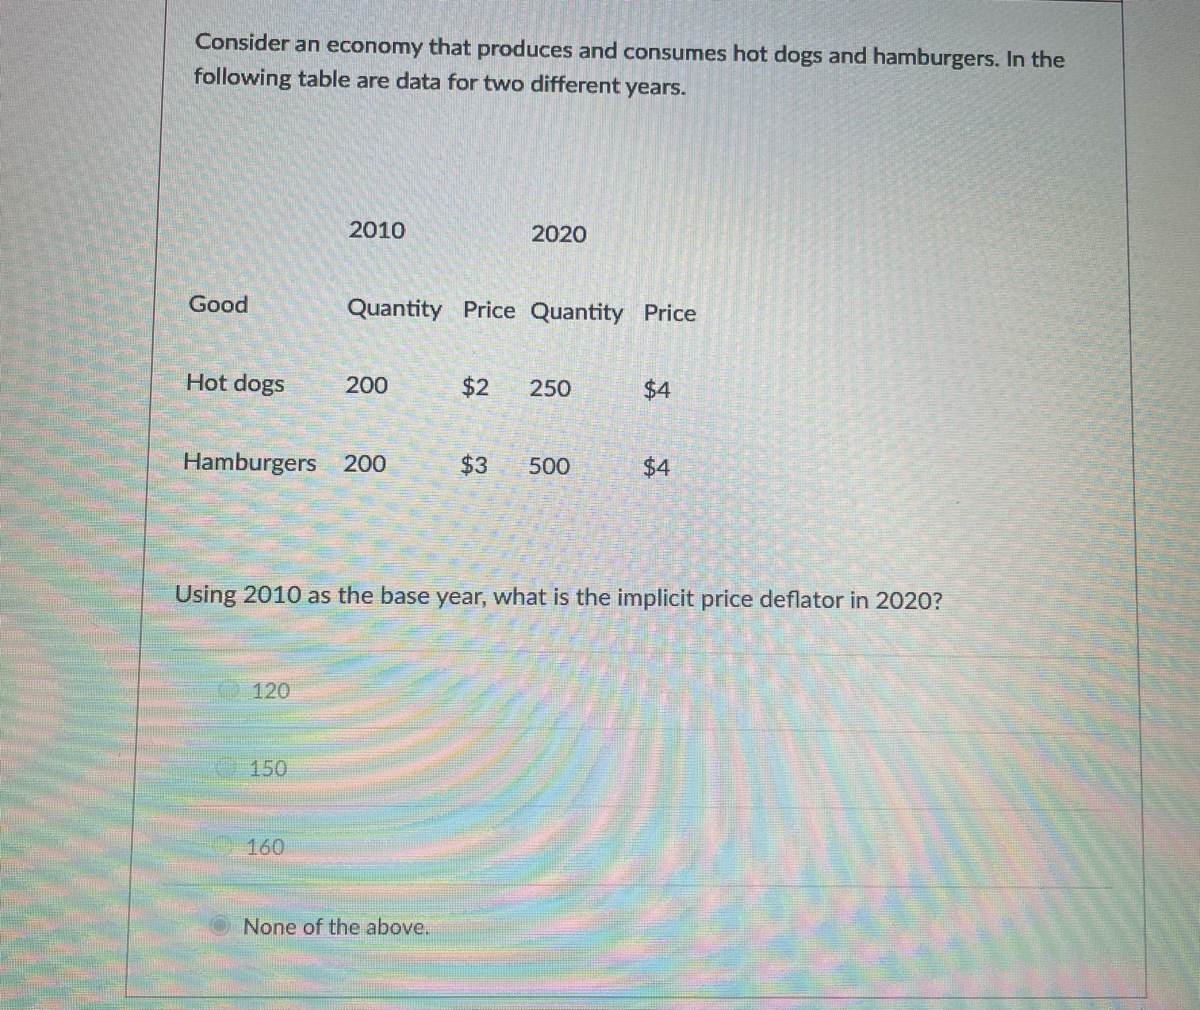

Transcribed Image Text:Consider an economy that produces and consumes hot dogs and hamburgers. In the
following table are data for two different years.
Good
Hot dogs
120
2010
Hamburgers 200
150
160
Quantity Price Quantity Price
200
2020
None of the above.
$2 250
Using 2010 as the base year, what is the implicit price deflator in 2020?
$3 500
$4
$4
Expert Solution
This question has been solved!
Explore an expertly crafted, step-by-step solution for a thorough understanding of key concepts.

This is a popular solution

Trending nowThis is a popular solution!

Step by stepSolved in 2 steps

Knowledge Booster


Learn more about
Need a deep-dive on the concept behind this application? Look no further. Learn more about this topic, economics and related others by exploring similar questions and additional content below.Similar questions
- Calculate total GDP for this economy given the following components of demand. Round your answer to the nearest tenth and enter the value in trillions of dollars. Components of GDP on the Demand Side (in trillions of dollars) Consumption Investment Government spending Exports Imports Provide your answer below: trillion Total GDP 12.9 3.8 4.2 3.0 4.2 ?arrow_forwardThe relative price of hamburgers this year has A. increased. B. decreased. C. stayed the same. D. Not enough information has been given to calculate an answer.arrow_forwardIn 1973, the price of a Big Mac was $0.50. Use the information in the table below to find the price of a Big Mac in 2006 dollars. Year 1973 2006 CPI 44.4 201.6 Source: Bureau of Labor Statistics. Base year 1962-84. The value of a 1973 Big Mac in 2006 dollars is $ The actual price of a Big Mac in 2006 was approximately $2.99. Thus the price of Big Macs has risen (Round your answer to two decimal places.) faster than the cost of living. at the same rate as slower thanarrow_forward
- Suppose seafood price and quantity data for the years 2000 and 2009 follow. Use 2000 as the base period.Seafood 2000 Qty. (lb) | 2000 Price ($/lb) | 2009 Price ($/lb)Halibut 75,090 1.91 2.33Lobster 83,080 3.72 3.09Tuna 50,779 1.87 1.97(a)Compute a price relative for each type of seafood. (Round your answers to one decimal place.)Seafood Price RelativeHalibut 122.0 Lobster _________ Tuna 105.3 (b)Compute a weighted aggregate price index for the seafood catch. (Round your answer to one decimal place.)I2009 = ___________ Comment on the change in seafood prices over the nine-year period. (Enter your percentage as a positive value. Round your answer to one decimal place.)Seafood prices have decreased by ______ % over the 9-year period according to the index.arrow_forwardA typical consumer in Lykesville has a market basket consisting of 4 strawberries, 9 grapefruits, and 5 blueberries. The data table below provides information on Lykesville's prices of strawberries, grapefruits, and blueberries from 2008 through 2010. 2008 2009 2010 unit of strawberries $1.1 $1.5 $1.2 Price per unit of grapefruits $1 Price per unit of blueberries $0.9 $1.2 Price per $1.4 $1.4 $2 What was the cost of the market basket in 2009? What was the price index in 2009, assuming 2008 is the base year?arrow_forwardRobots at Kroger, Walmart, and Whole Foods The grocery industry is stepping up its investment in robot technology. Retailers are spending an estimated $3.6 billion in robot technology globally, and are expected to invest $12 billion by 2023. Source: Forbes, July 29, 2019 Explain how the widespread use of farm robots will change the rental rate of farm land. www. Q Search Most likely, the widespread use of retailers' robots will OA. decrease the value of marginal product of mall land will decrease OB. not change, the prices of the retail goods will not change OC. increase, the quantity of land used for malls will decrease OD. not change; the quantity of land used for malls will increase the rental rate of mall land because Nextarrow_forward
- Which of the following pair of goods are Substitute goods:- (A) Bread and butter (B) Tea and sugar (C) Pen and ink (D) None of the abovearrow_forwardPrice (dollars per pizza) 6 S S2 Quantity (millions of pizzas per year) In the above figure, the movement from point a to point b reflects a decrease in the cost of the tomato sauce used to produce pizza. an increase in the number of producers of pizza. an increase in the supply of pizza. a decrease in income if pizza is a normal good. an increase in the price of pizza.arrow_forwardP1arrow_forward
- The residents of Freedonia currently are consuming seven goods; yogurt, green tea, tofu, bean sprouts, cookie dough ice cream, Tito's Handmade Vodka and housing. The prices and quantities for these goods are given in the following table. Good Yogurt Green Tea Tofu Bean Sprouts Cookie Dough Quantity 3 7 18 Ice Cream Tito's Handmade I Vodka Housing 2018 2 Price 2.40 0.60 1.20 1.00 3.50 22.10 500.00 Quantity 4 9 20 4 7 I 2019 2 Price 2.86 0.72 4.80 1.20 4.00 21.35 505.00 Quantity 6 10 22 6 8 2 2020 2 a. Suppose that 2019 is the base year. Calculate the price index for 2018, 2019 and 2020. b. Determine the rate of inflation for 2019. Determine the rate of inflation for 2020. Price 3.01 0.80 5.10 1.25 4.60 25.50 512.00arrow_forwardPlease answer fastarrow_forwardWhat do the coloured lines represent in the grapharrow_forward
arrow_back_ios
SEE MORE QUESTIONS
arrow_forward_ios
Recommended textbooks for you
 Principles of Economics (12th Edition)EconomicsISBN:9780134078779Author:Karl E. Case, Ray C. Fair, Sharon E. OsterPublisher:PEARSON
 Engineering Economy (17th Edition)EconomicsISBN:9780134870069Author:William G. Sullivan, Elin M. Wicks, C. Patrick KoellingPublisher:PEARSON
 Principles of Economics (MindTap Course List)EconomicsISBN:9781305585126Author:N. Gregory MankiwPublisher:Cengage Learning
 Managerial Economics: A Problem Solving ApproachEconomicsISBN:9781337106665Author:Luke M. Froeb, Brian T. McCann, Michael R. Ward, Mike ShorPublisher:Cengage Learning
 Managerial Economics & Business Strategy (Mcgraw-...EconomicsISBN:9781259290619Author:Michael Baye, Jeff PrincePublisher:McGraw-Hill Education
Principles of Economics (12th Edition)
Economics
ISBN:9780134078779
Author:Karl E. Case, Ray C. Fair, Sharon E. Oster
Publisher:PEARSON
Engineering Economy (17th Edition)
Economics
ISBN:9780134870069
Author:William G. Sullivan, Elin M. Wicks, C. Patrick Koelling
Publisher:PEARSON
Principles of Economics (MindTap Course List)
Economics
ISBN:9781305585126
Author:N. Gregory Mankiw
Publisher:Cengage Learning
Managerial Economics: A Problem Solving Approach
Economics
ISBN:9781337106665
Author:Luke M. Froeb, Brian T. McCann, Michael R. Ward, Mike Shor
Publisher:Cengage Learning
Managerial Economics & Business Strategy (Mcgraw-...
Economics
ISBN:9781259290619
Author:Michael Baye, Jeff Prince
Publisher:McGraw-Hill Education