ENGR.ECONOMIC ANALYSIS
14th Edition
ISBN: 9780190931919
Author: NEWNAN
Publisher: Oxford University Press
expand_more
expand_more
format_list_bulleted
Question

Transcribed Image Text:### Understanding the Town's Water Demand Schedule
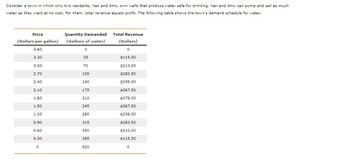
Consider a town in which only two residents, Van and Amy, own wells that produce drinking water. Van and Amy can pump and sell as much water as they want at no cost. For them, total revenue equals profit. The table below illustrates the town’s demand schedule for water.
#### Demand Schedule for Water
| Price (Dollars per gallon) | Quantity Demanded (Gallons of water) | Total Revenue (Dollars) |
|----------------------------|-------------------------------------|--------------------------|
| 3.60 | 0 | 0 |
| 3.30 | 35 | 115.50 |
| 3.00 | 70 | 210.00 |
| 2.70 | 105 | 283.50 |
| 2.40 | 140 | 336.00 |
| 2.10 | 175 | 367.50 |
| 1.80 | 210 | 378.00 |
| 1.50 | 245 | 367.50 |
| 1.20 | 280 | 336.00 |
| 0.90 | 315 | 283.50 |
| 0.60 | 350 | 210.00 |
| 0.30 | 385 | 115.50 |
| 0.00 | 420 | 0 |
#### Explanation of the Table
- **Price (Dollars per gallon)**: This column shows the different prices at which water could be sold per gallon.
- **Quantity Demanded (Gallons of water)**: This column indicates the corresponding quantity of water that the town's residents are willing to purchase at each price point.
- **Total Revenue (Dollars)**: This is calculated by multiplying the price per gallon by the quantity demanded. It represents the total earnings from the sale of water at each price level.
**Key Observations**:
- At higher prices, such as $3.60 per gallon, the quantity demanded drops to zero, reflecting no willingness to purchase.
- As the price decreases, the quantity demanded increases, peaking at 420 gallons when the price is zero.
- Total revenue is highest at a price of $1.80 per gallon,

Transcribed Image Text:### Cartel Behavior and Market Dynamics
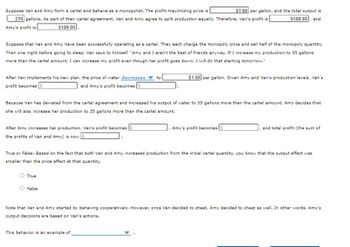
**Scenario:**
Van and Amy form a cartel and behave as monopolists. They agree to split production equally at a profit-maximizing price of **$1.80** per gallon, with a total output of **210** gallons. As part of this agreement, both Van's and Amy's profit is **$189.00**.
**Plan Deviation:**
- Van decides to increase his production to 35 gallons more than the cartel amount.
- This causes the price of water to **decrease** to **$1.50** per gallon.
- Van's profit becomes **$105**, and Amy's profit becomes **$105**.
**Amy's Response:**
- Amy reacts by also increasing her production by 35 gallons more than the cartel amount.
- As a result, Van's new profit is **$121.50**, Amy's new profit is **$121.50**, and the total profit is now **$243.00**.
**True or False Statement:**
- Based on both Van and Amy increasing production from the initial cartel quantity, the statement reads that the output effect was smaller than the price effect at that quantity.
- **Answer:** True
**Behavior Analysis:**
- Initially, Van and Amy were cooperative, but Van's decision to cheat led to Amy cheating as well.
- This behavior exemplifies a situation of **competitive cheating or betrayal in a cartel agreement**.
Expert Solution
This question has been solved!
Explore an expertly crafted, step-by-step solution for a thorough understanding of key concepts.
Step by stepSolved in 2 steps

Knowledge Booster
Learn more about
Need a deep-dive on the concept behind this application? Look no further. Learn more about this topic, economics and related others by exploring similar questions and additional content below.Similar questions
- A company is considering building a bridge across a river. The bridge would cost $2 million to build and nothing to maintain. The following table shows the company's anticipated demand over the lifetime of the bridge: Price per crossing ($) Number of crossing, in thousands 8 0 7 100 6 200 5 300 4 400 3 500 2 600 700 0 800 a. If the company were to build the bridge, what would be its profit-maximizing price? Would that be the efficient level of output? Why or why not? b. If the company is interested in maximizing profit, should it build the bridge? What would be its profit or loss? c. If the government were to build the bridge, what price should it charge? d. Should the government build the bridge? Explain.arrow_forward6. A record company estimates the industry demand for "hard alternative rock" albums to be: QD-1000 -125 P. It estimates the industry supply to be: QS = 125-P a. Given these estimates, what does it expect the industry output and price to be? b. A government commission announces that lyrics on "hard alternative rock" albums are offensive and should be banned. This causes consumers to purchase 20% more of such albums at any given price, compared to question 6a. What effect will this have on industry output and the price? c. Calculate the consumer surplus for parts a and b above. Are consumers better or worse off given the commission's recommendation?arrow_forward4arrow_forward
- Current tuition at Benedict College is around $24, 000 a year. Show what would likely happen to demand for educational services at the school if tuition went up to $40, 000 a year. The Ford F-150 (best selling vehicle in the U.S. for the last three decades) is currently priced at about $40, 000 to $45, 000. Show what would likely happen to the amount of vehicles offered for sale if the vehicle price went up to $52, 000. You have four kids at home and they are somewhat clumsy and spill a lot of milk and other drinks. While at DG you compare some paper towels options. The first option is a roll of towels that contains 43 sq. ft. of paper at a price of $1.75. The second option contains 67.3 sq. ft. of paper at $2.00. Which is the better choice? One of the problems with K-12 education in the U. S. is that there are not enough men (especially men of color) within the classrooms. The rational is that the salaries are too low. Show what…arrow_forwardPlease see below. Need assistance with this.arrow_forwardSampson Ltd produces two products that can be produced on either of two machines. Each month, only 5o0 hours of time are available on each machine. The time required to produce each item by hour and machine is: Machine Machine Product 1 Product 2 3 4 Month Month 1 Month 2 Month 1 Demand Demand Price Price Product 1 100 160 $45 $65 $10 Product 2 120 110 $35 The demand and price point for each product that customers are willing to pay are above. The company goal is to maximize revenue from sales from the next two months. Based on the provided information, how many constraints does this problem have excluding the non-negativity constraints?arrow_forward
- From an economic perspective, is it sound policy to pursue a goal of zero pollution? Why or why not? Can extreme levels of pollution hurt the economic development of a high-income country? Why or why not? How can high-income countries benefit from covering much of the cost of reducing pollution created by low-income countries? The table below shows the supply and demand conditions for a firm that will play trumpets on the streets when requested. Qs1 is the quantity supplied without social costs. Qs2 is the quantity supplied with social costs. How does accounting for the externality affect the equilibrium price and quantity?arrow_forwardSuppose that Jacques and Kyoko are the only consumers of scented candles in a particular market. The following table shows their annual demand schedules: Price (Dollars per candle) 2 4 6 8 10 Jacques's Quantity Demanded Kyoko's Quantity Demanded (Candies) (Candles) 12 28 6 20 4 12 2 6 0 2arrow_forwardSuppose that you are in charge of a toll bridge over the Mississippi River. The demand for bridge crossing Q is given by the following: 2P = 20 - Q a) How many people would cross the bridge if there were no toll? (YOU MUST SHOW YOUR WORK TO RECEIVE CREDIT) b) The toll bridge operator is considering setting up a price of $5.00. At that price, how many people will cross the bridge? (YOU MUST SHOW YOUR WORK TO RECEIVE CREDIT) c) How many people would cross the bridge if the toll is set at $10.00? (YOU MUST SHOW YOUR WORK TO RECEIVE CREDIT)arrow_forward
- Consider the competitive market for production of a chemical as shown in the diagram below. This setup will apply to this question and the next two questions. P ($/gallon) Demand: P=220-Q/100 0 Supply: P = Q/400 Q (gallons) Production of this chemical produces noxious odors that impact the health of the communities surrounding the production facilities. It is well known that every gallon produced increases health costs in society, but there is a lot of argument over how much health costs increase. In reality the number is that health costs increase by $3 per gallon produced, but that it hard to discover. If the government does not intervene in this market, what will be the total surplus for society in this market (including the $3 per gallon health costs)? Please do not round at any step of any calculation. Do not round your final answer.arrow_forwardMetropolitan Utilities District currently charges residents in Omaha $1.23 per cubic feet of water use for each home's first 900 cubic feet of water used, $1.73 per cubic feet of water use for each home's usage rate between 900 and 3,000 cubic feet, and $2.22 per cubic feet of water use for anything over 3,000 cubic feet of use. The pricing structure is an example of: over-use and inefficient pricing. too few water permits being traded on the local water market. block pricing. conservation pricing.arrow_forwardThe MC for the Hydration Power Drink is $1.00. The MC for the smoothie is $4.00.Using the chart and the information provided, what is the contribution margin at each price for each product? Hydration High Price contribution margin is Hydration Low Price contribution margin is Smoothie High Price contribution margin is Smoothie Low Price contribution margin isarrow_forward
arrow_back_ios
SEE MORE QUESTIONS
arrow_forward_ios
Recommended textbooks for you

 Principles of Economics (12th Edition)EconomicsISBN:9780134078779Author:Karl E. Case, Ray C. Fair, Sharon E. OsterPublisher:PEARSON
 Engineering Economy (17th Edition)EconomicsISBN:9780134870069Author:William G. Sullivan, Elin M. Wicks, C. Patrick KoellingPublisher:PEARSON
 Principles of Economics (MindTap Course List)EconomicsISBN:9781305585126Author:N. Gregory MankiwPublisher:Cengage Learning
 Managerial Economics: A Problem Solving ApproachEconomicsISBN:9781337106665Author:Luke M. Froeb, Brian T. McCann, Michael R. Ward, Mike ShorPublisher:Cengage Learning
 Managerial Economics & Business Strategy (Mcgraw-...EconomicsISBN:9781259290619Author:Michael Baye, Jeff PrincePublisher:McGraw-Hill Education


Principles of Economics (12th Edition)
Economics
ISBN:9780134078779
Author:Karl E. Case, Ray C. Fair, Sharon E. Oster
Publisher:PEARSON

Engineering Economy (17th Edition)
Economics
ISBN:9780134870069
Author:William G. Sullivan, Elin M. Wicks, C. Patrick Koelling
Publisher:PEARSON

Principles of Economics (MindTap Course List)
Economics
ISBN:9781305585126
Author:N. Gregory Mankiw
Publisher:Cengage Learning

Managerial Economics: A Problem Solving Approach
Economics
ISBN:9781337106665
Author:Luke M. Froeb, Brian T. McCann, Michael R. Ward, Mike Shor
Publisher:Cengage Learning

Managerial Economics & Business Strategy (Mcgraw-...
Economics
ISBN:9781259290619
Author:Michael Baye, Jeff Prince
Publisher:McGraw-Hill Education