Related questions
Question

Transcribed Image Text:The image contains two parts titled "part 1 of 2" and "part 2 of 2," both focusing on the electric field \( E(r) \) as a function of radial distance \( r \).
---
**Part 1 of 2**
- **Text Description:**
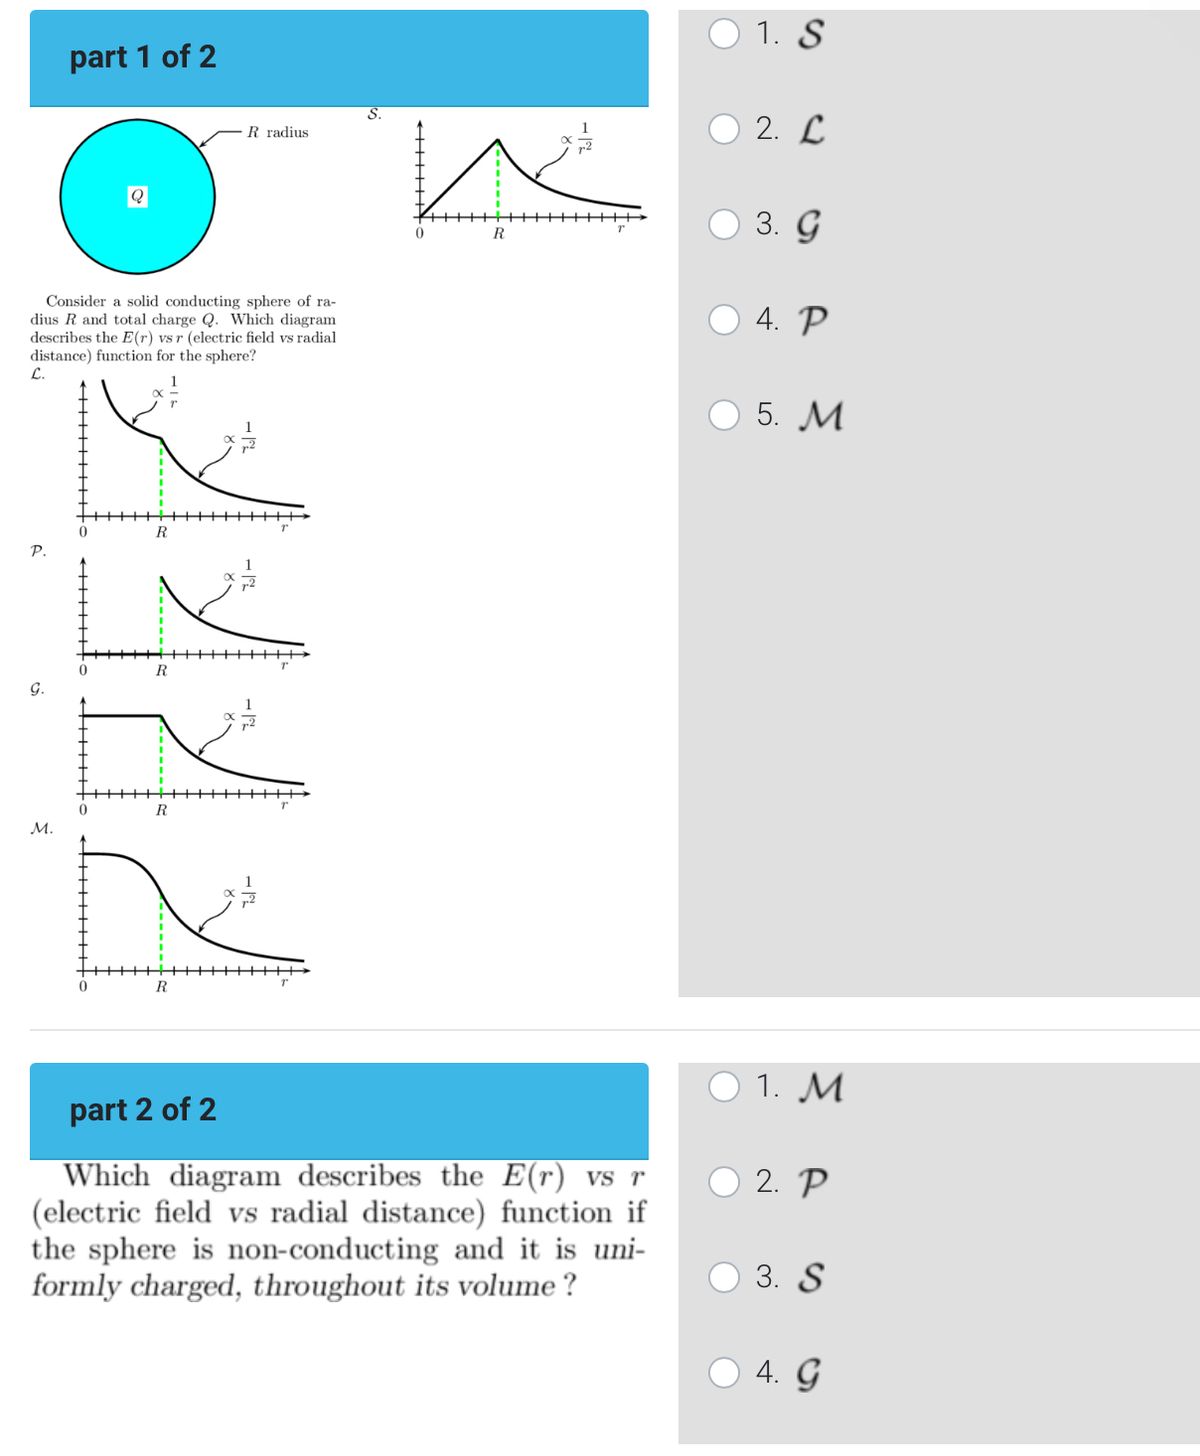
- A solid conducting sphere with radius \( R \) and total charge \( Q \) is considered. The task is to determine which diagram correctly represents the function \( E(r) \) (electric field versus radial distance) for the sphere.
- **Diagram Descriptions:**
- Five diagrams labeled \( S \), \( L \), \( G \), \( P \), and \( M \) represent various graphs of \( E(r) \).
- **Diagram \( S \):**
- The graph shows an initial increase from \( r = 0 \) to a peak near \( r = R \), then follows a curve identified as proportional to \( \frac{1}{r^2} \) indicating a decrease.
- **Diagram \( L \):**
- The graph remains at zero for \( r < R \), then follows a curve that decreases proportionally to \( \frac{1}{r^2} \) for \( r > R \).
- **Diagram \( G \):**
- Similar to \( L \), starting at zero for \( r < R \), but differs in scale and slope of the decreasing curve for \( r > R \).
- **Diagram \( P \):**
- Begins with zero for \( r < R \), then curves down proportional to \( \frac{1}{r} \) for \( r > R \), showing a different decline rate.
- **Diagram \( M \):**
- Flat line at zero for \( r < R \), transitioning to a decline proportional to \( \frac{1}{r^2} \) for larger \( r \), similar to other diagrams but with a different initial behavior.
- **Question:**
- The question on the right asks which diagram describes the function \( E(r) \) for the mentioned scenario.
- **Answer Options:**
- Options are provided to select the corresponding diagram (1. \( S \), 2. \( L \), 3. \( G \), 4. \( P \), 5. \( M \)).
---
**Part 2 of 2**
- **
Expert Solution
This question has been solved!
Explore an expertly crafted, step-by-step solution for a thorough understanding of key concepts.

This is a popular solution

Trending nowThis is a popular solution!

Step by stepSolved in 3 steps with 2 images

Knowledge Booster

Similar questions
- Needs Complete typed solution with 100 % accuracy.arrow_forwardIn Figure 2, a sphere of radius r = 0.42 m carries a uniform volume charge density of rho = 2.3 × 10^-10 C/m^2. A spherical cavity of radius 0.21 m is then cut out and left empty as shown in the figure. Points A and C are the centers of the sphere and the spherical cavity, respectively. Find the magnitude and direction of the electric field at point B.arrow_forwardImagine that in a region in space you detect a spherical symmetric electric field that increases quadratically with the distance from the center, E (r) = a · r2 . er, where a is a constant. How is the the charge distributed in that region, i.e. find p (r). increases linearly radially outward decreases linearly radially outward uniformarrow_forward
arrow_back_ios
arrow_forward_ios