
A First Course in Probability (10th Edition)
10th Edition
ISBN: 9780134753119
Author: Sheldon Ross
Publisher: PEARSON
expand_more
expand_more
format_list_bulleted
Related questions
Question
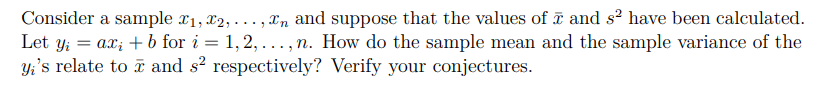

Transcribed Image Text:Consider a sample ₁, 2,...,n and suppose that the values of and s² have been calculated.
Let y₁ = axi + b for i=1,2,. n. How do the sample mean and the sample variance of the
yi's relate to and s² respectively? Verify your conjectures.
Expert Solution
This question has been solved!
Explore an expertly crafted, step-by-step solution for a thorough understanding of key concepts.

Step by stepSolved in 2 steps

Knowledge Booster

Similar questions
- An analysis of variance produces SSbetween = 40, SSwithin = 60, and an F-ratio with df = 2, 15. For this analysis, what is the F-ratio?arrow_forwardHelp plsarrow_forwardA sample of 3 measurements are taken and recorded: a =8, y = 10 and z = 7 The sample mean is: x = = 8.33 Fill in the table below. aj (a; - x)2 Ex: 5.34 Ex: 5.34 Ex: 5.34 82 = (z-z)*+(y-a)* +(z-z) Ex: 5.34 (z-2)*+(y-z)* +(z-) = Ex: 5.34arrow_forward
- Answer T for true or F for false: a. Nonparametric methods rely on fewer assumptions about populations being sampled than do parametric methods. ____ b. Statistical power is about the same with nonparametric and parametric methods. ______arrow_forwardI need answers for questions a and b please.arrow_forwardplease see attached thanksarrow_forward
- Let x be a random variable that represents red blood cell count (RBC) in millions of cells per cubic millimeter of whole blood. Then x has a distribution that is approximately normal. For the population of healthy female adults, suppose the mean of the x distribution is about 4.78. Suppose that a female patient has taken six laboratory blood tests over the past several months and that the RBC count data sent to the patient's doctor are as follows. 4.9 4.2 4.5 4.1 4.4 4.3 (i) Use a calculator with sample mean and standard deviation keys to find x and s. (Round your answers to two decimal places.) x = s = (ii) Do the given data indicate that the population mean RBC count for this patient is lower than 4.78? Use ? = 0.05. (a) What is the level of significance?State the null and alternate hypotheses. H0: ? < 4.78; H1: ? = 4.78H0: ? = 4.78; H1: ? ≠ 4.78 H0: ? = 4.78; H1: ? < 4.78H0: ? = 4.78; H1: ? > 4.78H0: ? > 4.78; H1: ? = 4.78 (b) What sampling…arrow_forwardOne of the following is the minimum variance unbiased estimator for u. The sample variance. The sample mean. The sample mean square error. The meadian.arrow_forwardcan you please provide explanationsarrow_forward
arrow_back_ios
arrow_forward_ios
Recommended textbooks for you
- A First Course in Probability (10th Edition)ProbabilityISBN:9780134753119Author:Sheldon RossPublisher:PEARSON

A First Course in Probability (10th Edition)
Probability
ISBN:9780134753119
Author:Sheldon Ross
Publisher:PEARSON