
MATLAB: An Introduction with Applications
6th Edition
ISBN: 9781119256830
Author: Amos Gilat
Publisher: John Wiley & Sons Inc
expand_more
expand_more
format_list_bulleted
Related questions
Question
thumb_up100%
Consider a dataset consisting of 610 males involved in a study of coronary heart disease. The outcome variable is CHD status (1 = case, 0 = noncase), the exposure variable of interest is CAT which is a dichotomous variable that indicates high (coded 1) or normal (coded 0) catecholamine level. The only other variables recorded in the data set are AGE (1 = age > 55, 0 = age ≤ 55) and ECG (1 = abnormal, 0 = normal). The dataset involving the above variables is given as follows:
a) Is data listing described above in events /trials format or in subject-specific format? Explain briefly.
(b) Show that the saturated model yields the same probability of having CHD for those with covariate profile AGE = 1, CAT = 0, and ECG = 1 as that computed directly from the data.
(c) Conduct an appropriate goodness-of-fit test to determine if the model adequately fits the data.
As given in the SAS code above, the model is a full model with all main effects and interactions (both two way and three way interactions). A main effect model can be obtained from SAS by this model statement –
model cases/total = AGE CAT ECG / cl;
Perform a hypothesis test to see if the interactions (including all of the two-way and the three-way
Interactions) help with the model using a likelihood ratio test (LRT) to compare the full model and the
main effect model using alpha of 0.05.
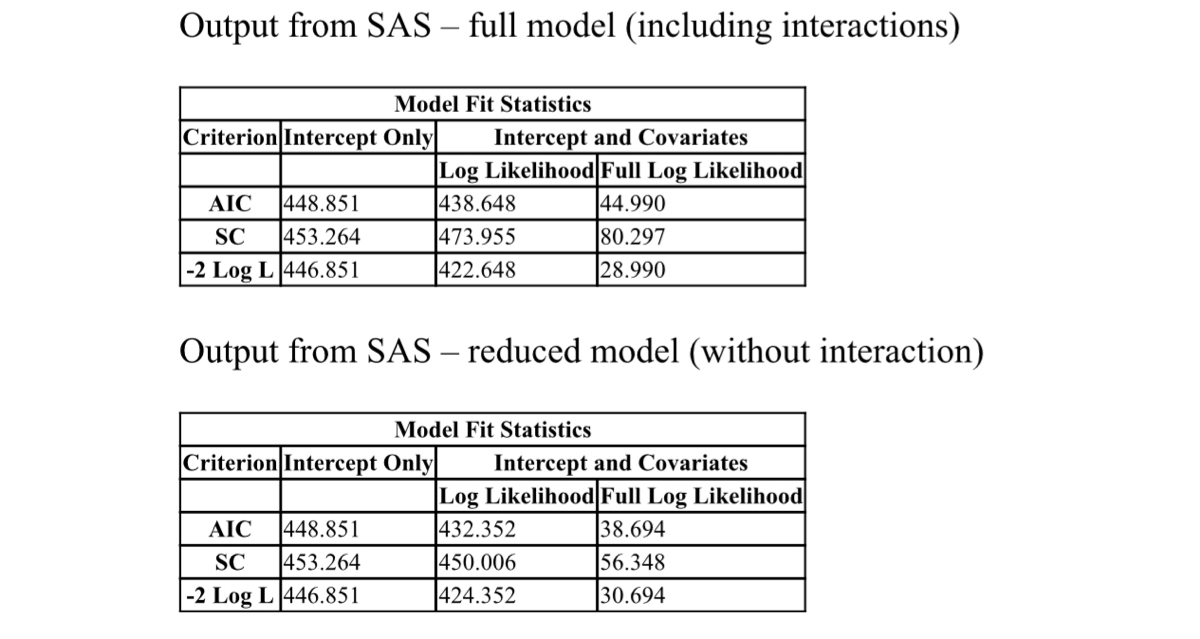

Transcribed Image Text:Output from SAS - full model (including interactions)
Criterion Intercept Only
AIC 448.851
SC 453.264
-2 Log L 446.851
Model Fit Statistics
Output from SAS - reduced model (without interaction)
AIC 448.851
SC 453.264
-2 Log L 446.851
Intercept and Covariates
Log Likelihood Full Log Likelihood
438.648
44.990
473.955
80.297
422.648
28.990
Criterion Intercept Only
Model Fit Statistics
Intercept
Covariates
Log Likelihood Full Log Likelihood
432.352
38.694
450.006
56.348
424.352
30.694

Transcribed Image Text:data datal;
input cases total CAT AGE ECG;
cards;
17 275 000
15 121 0 1 0
7 59 0 0 1
5 32 0 1 1
1 8 1 0 0
10 40 1 1 0
4 17 1 0 1
14 58 1 1 1
;
run;
We are interested in the following logistic model:
The saturated model is obtained in SAS by:
proc logistic data = datal;
class CAT (ref = '0') / param =
'0') / param
class ECG (ref = '0') / param =
model cases/total = AGE CAT ECG
CAT AGE ECG AGE CAT ECG CAT AGE*ECG
/ cl;
ref;
class AGE (ref =
ref;
π = P(CHD, 1| AGE,, CAT, ECG,)
logit(x) = B₁ + B, AGE, + ß₂CAT, + ß₂ECG,
ref;
run;
Parameter Estimates and Wald Confidence Intervals
Parameter
Estimate 95% Confidence Limits
Intercept
-2.7197 -3.2104 -2.2289
AGE
0.7643 0.0341
1.4945
CAT
11
0.7738 -1.3782
2.9258
CAT AGE
11 0.0831 -2.2483
2.4146
1 0.7143 -0.2149
1.6436
ECG
AGE ECG 11-0.4454 -1.8829 0.9921
CAT*ECG 11 0.0530 -2.4984 2.6044
CAT AGE ECG111-0.3685 -3.2988
2.5617
Expert Solution
This question has been solved!
Explore an expertly crafted, step-by-step solution for a thorough understanding of key concepts.

This is a popular solution
Step 1: Write the given information.
VIEW Step 2: Determine whether the data listing described above in events/trials format or in subject-specific.
VIEW Step 3: Determine the probability of having CHD for the covariate profile AGE = 1, CAT = 0, and ECG = 1.
VIEW Step 4: Perform a hypothesis test to compare the full model and the main effect model using alpha of 0.05.
VIEW Step 5: Determine the decision rule and conclusion for the test.
VIEW Solution
VIEW 
Trending nowThis is a popular solution!

Step by stepSolved in 6 steps with 22 images

Knowledge Booster

Similar questions
- A researcher is studying the effects of his newly created lens on vision. He samples 9 people with poor vision and measures their visual distance (in feet) with the lens and then without the lens. Did people’s vision with the lens differ from their vision without? Participant # With Lens Without Lens 1 8 14 2 6 17 3 9 12 4 7 11 5 5 12 6 9 18 7 8 13 8 9 7 9 7 13 What kind of analysis will you use? Why? State the null and alternative hypothesis. Check your assumptions. Explain why each of them are or are not met. Sketch a distribution and shade the rejection region(s), including the corresponding critical value(s). Using R, calculate your test statistic and interpret the results of your test. (Don’t forget your 95% confidence interval and screenshots of your work!) What do you conclude about the null hypothesis? Are there significant differences?arrow_forwardThe leader of two postpartum women’s support groups is interested in the depression levels of the women in her groups. She administers the Center for Epidemiologic Studies Depression Scale (CES-D) screening test to the members of her groups. The CES-D is a 20-question self-test that measures depressive feelings and behaviors during the previous week. The mean depression level from the screening test for the 10 women in the first group is μ₁ = 16; the mean depression level for the 14 women in the second group is μ₂ = 10. Without calculating the weighted mean for the combined group, you know that the weighted mean is:arrow_forwardPLEASE ANSWER ASAP: A case-control study was conducted to evaluate the relationship between physical activity and coronary heart disease (CHD) in men. A total of 406 men newly diagnosed with CHD were included together with 406 men of similar ages who did not have CHD. The risk of CHD (measured by the OR) was higher among men who were inactive or only moderately active (collectively called ‘inactive’) than among those who were physically active: (See attached image) Odds ratio for inactive men compared to active men= (299 x 136)/(270 x 107)=1.41Suppose there is no misclassification in these data.What would the observed OR have been... 1. If 20% of all the inactive men had been misclassified as active? 2. If 10 % of inactive cases had been misclassified as active?arrow_forward
- please answer questions B,C,Farrow_forwardIn random samples of 900 men and 400 women it is found that 99 men and 36 women suffer from kidney stones. Is there statistical evidence that the proportion of male kidney stone sufferers is greater than the proportion of female kidney stone sufferers? Use 5% significant level.arrow_forwardThe SSRUR = 161.9, SSRR = 260.6, number of restrictions = 2, n = 89, and there are 8 right hand side variables. Calculate the F statistic.arrow_forward
arrow_back_ios
arrow_forward_ios
Recommended textbooks for you
- MATLAB: An Introduction with ApplicationsStatisticsISBN:9781119256830Author:Amos GilatPublisher:John Wiley & Sons Inc
 Probability and Statistics for Engineering and th...StatisticsISBN:9781305251809Author:Jay L. DevorePublisher:Cengage Learning
 Statistics for The Behavioral Sciences (MindTap C...StatisticsISBN:9781305504912Author:Frederick J Gravetter, Larry B. WallnauPublisher:Cengage Learning
  Elementary Statistics: Picturing the World (7th E...StatisticsISBN:9780134683416Author:Ron Larson, Betsy FarberPublisher:PEARSON
 The Basic Practice of StatisticsStatisticsISBN:9781319042578Author:David S. Moore, William I. Notz, Michael A. FlignerPublisher:W. H. Freeman
 Introduction to the Practice of StatisticsStatisticsISBN:9781319013387Author:David S. Moore, George P. McCabe, Bruce A. CraigPublisher:W. H. Freeman
MATLAB: An Introduction with Applications
Statistics
ISBN:9781119256830
Author:Amos Gilat
Publisher:John Wiley & Sons Inc
Probability and Statistics for Engineering and th...
Statistics
ISBN:9781305251809
Author:Jay L. Devore
Publisher:Cengage Learning
Statistics for The Behavioral Sciences (MindTap C...
Statistics
ISBN:9781305504912
Author:Frederick J Gravetter, Larry B. Wallnau
Publisher:Cengage Learning
Elementary Statistics: Picturing the World (7th E...
Statistics
ISBN:9780134683416
Author:Ron Larson, Betsy Farber
Publisher:PEARSON
The Basic Practice of Statistics
Statistics
ISBN:9781319042578
Author:David S. Moore, William I. Notz, Michael A. Fligner
Publisher:W. H. Freeman
Introduction to the Practice of Statistics
Statistics
ISBN:9781319013387
Author:David S. Moore, George P. McCabe, Bruce A. Craig
Publisher:W. H. Freeman