
Related questions
Consider a dataset consisting of 610 males involved in a study of coronary heart disease. The outcome variable is CHD status (1 = case, 0 = non case), the exposure variable of interest is CAT which is a dichotomous variable that indicates high (coded 1) or normal (coded 0) catecholamine level. The only other variables recorded in the data set are AGE (1 = age > 55, 0 = age ≤ 55) and ECG (1 = abnormal, 0 = normal). The dataset involving the above variables is given as follows:
data data1;
input cases total CAT AGE ECG;
cards;
17 275 0 0 0
15 121 0 1 0
7 59 0 0 1
5 32 0 1 1
1 8 1 0 0
10 40 1 1 0
4 17 1 0 1
14 58 1 1 1
;
run;
We are interested in the following logistic model:
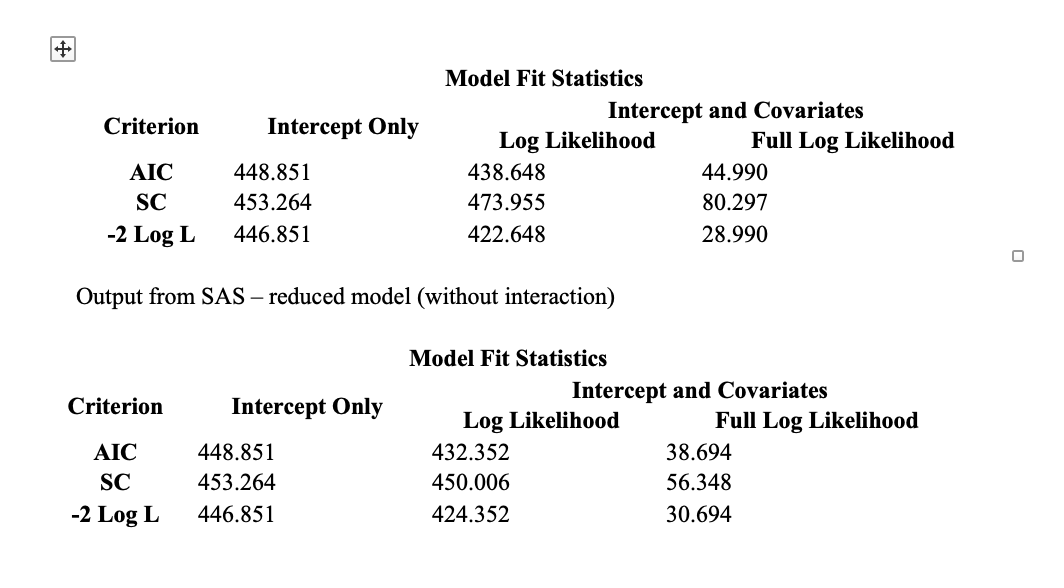
As given in the SAS code above, the model is a full model with all main effects and interactions (both two way and three way interactions). A main effect model can be obtained from SAS by this model statement –
model cases/total = AGE CAT ECG / cl;
Perform a hypothesis test to see if the interactions (including all of the two-way and the three-way Interactions) help with the model using a likelihood ratio test (LRT) to compare the full model and the main effect model using alpha of 0.05.


Trending nowThis is a popular solution!

Step by stepSolved in 5 steps with 22 images


- The leader of two postpartum women’s support groups is interested in the depression levels of the women in her groups. She administers the Center for Epidemiologic Studies Depression Scale (CES-D) screening test to the members of her groups. The CES-D is a 20-question self-test that measures depressive feelings and behaviors during the previous week. The mean depression level from the screening test for the 10 women in the first group is μ₁ = 16; the mean depression level for the 14 women in the second group is μ₂ = 10. Without calculating the weighted mean for the combined group, you know that the weighted mean is:arrow_forwardplease answer questions B,C,Farrow_forwardData are collected in an experiment designed to in- vestigate the impact of different positions of the mother during ultrasound on fetal heart rate. Fetal heart rate is measured by ultrasound in beats per minute. The study includes 20 women who are as- signed to one position and have the fetal heart rate measured in that position. Each woman is between 28 weeks and 32 weeks gestation. The data are shown in Table 7–7. Is there a significant difference in mean fetal heart rates by position? Run the test at a 5% level of significance. back side sitting standing 140 141 144 147 144 143 145 145 146 145 147 148 141 144 148 149 139 136 144 145arrow_forward
- This research was conducted with Korean adolescents in the Los Angeles area. Would you be willing to generalize the results of this study to Korean adolescents who live in other regions of the country? Why or why not.arrow_forwardListed below are the lead concentrations in different Ayurveda medicines. Ayurveda is a traditional medical system commonly used in India. The lead concentrations listed here are from medicines manufactured in the United States. Use a significance level to test the claim that the mean lead concentration for all such medicines is less than 14. 3.0,6.5,6.0,5.5,20.5,7.5,12.0,20.5,11.5,17.5arrow_forwardThe SSRUR = 161.9, SSRR = 260.6, number of restrictions = 2, n = 89, and there are 8 right hand side variables. Calculate the F statistic.arrow_forward
- MATLAB: An Introduction with ApplicationsStatisticsISBN:9781119256830Author:Amos GilatPublisher:John Wiley & Sons Inc
 Probability and Statistics for Engineering and th...StatisticsISBN:9781305251809Author:Jay L. DevorePublisher:Cengage Learning
 Statistics for The Behavioral Sciences (MindTap C...StatisticsISBN:9781305504912Author:Frederick J Gravetter, Larry B. WallnauPublisher:Cengage Learning
  Elementary Statistics: Picturing the World (7th E...StatisticsISBN:9780134683416Author:Ron Larson, Betsy FarberPublisher:PEARSON
 The Basic Practice of StatisticsStatisticsISBN:9781319042578Author:David S. Moore, William I. Notz, Michael A. FlignerPublisher:W. H. Freeman
 Introduction to the Practice of StatisticsStatisticsISBN:9781319013387Author:David S. Moore, George P. McCabe, Bruce A. CraigPublisher:W. H. Freeman