ENGR.ECONOMIC ANALYSIS
14th Edition
ISBN: 9780190931919
Author: NEWNAN
Publisher: Oxford University Press
expand_more
expand_more
format_list_bulleted
Question

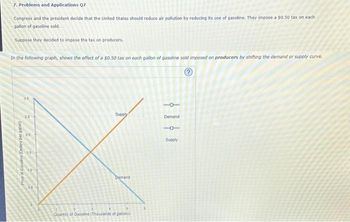
Transcribed Image Text:7. Problems and Applications Q7
Congress and the president decide that the United States should reduce air pollution by reducing its use of gasoline. They impose a $0.50 tax on each
gallon of gasoline sold.
Suppose they decided to impose the tax on producers.
In the following graph, shows the effect of a $0.50 tax on each gallon of gasoline sold imposed on producers by shifting the demand or supply curve.
Price of Gasoline (Dollars per gallon)
30
2.5
20
Supply
Demand
Quantity of Gasoline (Thousands of guilons)
-O-
Demand
18
Supply

Transcribed Image Text:True or False: The price consumers pay will be lower if the tax were imposed on producers.
O True
O False
If the demand for gasoline were less elastic, this tax would be
True or False: Consumers of gasoline are helped by this tax.
O True
O False
Workers in the oil industry are
by this tax.
effective in reducing the quantity of gasoline consumed.
Expert Solution
This question has been solved!
Explore an expertly crafted, step-by-step solution for a thorough understanding of key concepts.
This is a popular solution
Trending nowThis is a popular solution!
Step by stepSolved in 5 steps with 2 images

Knowledge Booster
Learn more about
Need a deep-dive on the concept behind this application? Look no further. Learn more about this topic, economics and related others by exploring similar questions and additional content below.Similar questions
- I need help with 9arrow_forward3. Individual and market demand Suppose that Dmitri and Frances represent the only two consumers of jeans in some hypothetical market. The following table presents their annual demand schedules for jeans: Price (Dollars per pair) 22222 10 20 30 40 50 Dmitri's Quantity Demanded Frances's Quantity Demanded (Pairs) (Pairs) 32 64 48 32 24 16 20 12 On the following graph, plot Dmitri's demand for jeans using the green points (triangle symbol). Next, plot Frances's demand for jeans using the purple points (diamond symbol), Finally, plot the market demand for jeans using the blue points (circle symbol). Note: Line segments will automatically connect the points. Remember to plot from left to rightarrow_forwardIf the government provides a subsidy to the producers of coffee and simultaneously charges a tax on tea, which of the following can (but not necessarily wilI) happen in the market for coffee? * O The equilibrium price and quantity both decrease. O The equilibrium price increases and the equilibrium quantity decreases. O The equilibrium price stays the same and equilibrium quantity decreases. The equilibrium price stays the same and equilibrium quantity increases. O The equilibrium price decreases and the quantity stays the same. Income elasticity measures the responsiveness of changes in income to changes in price. changes in quantity demanded to a change in income. changes in quantity demanded to a change in price. changes in income to changes in supply. O All of the above.arrow_forward
- Tips ips 3. Individual and market demand Suppose that Carlos and Deborah represent the only two consumers of iced coffee in some hypothetical market. The following table presents their monthly demand schedules for iced coffee: Price (Dollars per cup) 1 2 3 ss W 4 5 Carlos's Quantity Demanded Deborah's Quantity Demanded. (Cups) (Cups) 8 16 5 12 3 8 4 2 1 0arrow_forward12. Market equilibrlum and disequilibrlum The following graph shows the monthly demand and supply curves in the market for keyboards. Use the graph input tool to help you answer the following questions. You will not be graded on any changes you make to this graph. Note: Once you enter a value in a white field, the graph and any corresponding amounts in each grey field will change accordingly. Graph Input Tool Market for Keyboards 60 I Price (Dollars per keyboard) 54 18 Supply 48 Quantity Supplied (Keyboards) 420 Quantity Demanded 1,000 42 (Keyboards) 36 30 Demand 24 18 12 6. 100 200 300 400 500 600 700 800 900 1000 QUANTITY (Keyboards) keyboards bought and sold per month. per keyboard, and the equilibrium quantity is The equilibrium price in this market isS PRICE (Dollars per keyboard)arrow_forward4. In order to reduce farm output, raise farm prices, and thus raise farm incomes (revenues), the government pays farmers to set aside a portion of their land from production. Using a graph, explain in terms of the elasticity of demand for farm products why farmers may be better-off when harvests are low even if we ignore the money they receive from the set-aside program.arrow_forward
- 3. Individual and market demand Suppose that Hubert and Kate are the only consumers of pizza slices in a particular market. The following table shows their weekly demand schedules: Price (Dollars per slice) 1 2 3 4 5 Hubert's Quantity Demanded (Slices) 8 5 3 1 0 Kate's Quantity Demanded (Slices) 16 12 8 4 2 On the following graph, plot Hubert's demand for pizza slices using the green points (triangle symbol). Next, plot Kate's demand for pizza slices using the purple points (diamond symbol). Finally, plot the market demand for pizza slices using the blue points (circle symbol). Note: Line segments will automatically connect the points. Remember to plot from left to right.arrow_forward27arrow_forward8. Suppose we want regular cars to be gradually replaced by electric cars. There are several kinds of government interventions that could be used to make this happen, or at least to push the car market to produce and sell more electric cars. Explain how a tax could be used for this purpose, and then explain how a subsidy could be used for this purpose.arrow_forward
- o Suppose the Canadian government has decided to place an excise tax of $20 per tire on producers of automobile tires. Excise taxes are also called sales or commodity taxes. Previously, there was no excise tax on automobile tires. As a result of the excise tax, producers of tires, such as Bridgestone and Michelin, are going to alter their tire prices. The graph illustrates the demand and supply curves for automobile tires before the excise tax. Please shift the appropriate curve or curves on the graph to demonstrate the impact of the new tax. What is the price consumers pay for a tire post tax? Round to the nearest 10. price paid by consumers: $ What is the price producers receive for a tire net of taxes? Round to the nearest 10. Price 150 140 130 120 110 100 90 80 70 60 50 O 1 2 3 01 4 5 Quantity 6 Supply Demad 7 8 9 10arrow_forwardG.237.arrow_forwardAbove is the supply and demand graph in a market. Answer the following questions based on the graph: 3.1. What are the equilibrium price and quantity in the market? 3.2. What are the quantity supplied, quantity demanded, and price at a shortage of 400 units? 3.3. Whar are the quantity supplied, quantity demanded, and price at a surplus of 200 units?arrow_forward
arrow_back_ios
SEE MORE QUESTIONS
arrow_forward_ios
Recommended textbooks for you

 Principles of Economics (12th Edition)EconomicsISBN:9780134078779Author:Karl E. Case, Ray C. Fair, Sharon E. OsterPublisher:PEARSON
 Engineering Economy (17th Edition)EconomicsISBN:9780134870069Author:William G. Sullivan, Elin M. Wicks, C. Patrick KoellingPublisher:PEARSON
 Principles of Economics (MindTap Course List)EconomicsISBN:9781305585126Author:N. Gregory MankiwPublisher:Cengage Learning
 Managerial Economics: A Problem Solving ApproachEconomicsISBN:9781337106665Author:Luke M. Froeb, Brian T. McCann, Michael R. Ward, Mike ShorPublisher:Cengage Learning
 Managerial Economics & Business Strategy (Mcgraw-...EconomicsISBN:9781259290619Author:Michael Baye, Jeff PrincePublisher:McGraw-Hill Education


Principles of Economics (12th Edition)
Economics
ISBN:9780134078779
Author:Karl E. Case, Ray C. Fair, Sharon E. Oster
Publisher:PEARSON

Engineering Economy (17th Edition)
Economics
ISBN:9780134870069
Author:William G. Sullivan, Elin M. Wicks, C. Patrick Koelling
Publisher:PEARSON

Principles of Economics (MindTap Course List)
Economics
ISBN:9781305585126
Author:N. Gregory Mankiw
Publisher:Cengage Learning

Managerial Economics: A Problem Solving Approach
Economics
ISBN:9781337106665
Author:Luke M. Froeb, Brian T. McCann, Michael R. Ward, Mike Shor
Publisher:Cengage Learning

Managerial Economics & Business Strategy (Mcgraw-...
Economics
ISBN:9781259290619
Author:Michael Baye, Jeff Prince
Publisher:McGraw-Hill Education