
MATLAB: An Introduction with Applications
6th Edition
ISBN: 9781119256830
Author: Amos Gilat
Publisher: John Wiley & Sons Inc
expand_more
expand_more
format_list_bulleted
Related questions
Topic Video
Question
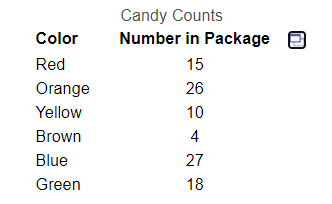

Transcribed Image Text:Candy Counts
Color
Number in Package e
Red
15
Orange
26
Yellow
10
Brown
4
Blue
27
Green
18

Transcribed Image Text:Conduct the hypothesis test and provide the test statistic and the critical value, and state the conclusion.
A company claims that its packages of 100 candies are distributed with the following color percentages: 13% red, 21% orange,
14% yellow, 12% brown, 22% blue, and 18% green. Use the given sample data to test the claim that the color distribution is as
claimed. Use a 0.10 significance level.
Click the icon to view the color counts for the candy in the package.
Click here to view the chi-square distribution table.
The test statistic is
(Round to two decimal places as needed.)
The critical value is
(Round to three decimal places as needed.)
State the conclusion.
Ho. There
sufficient evidence to warrant rejection of the claim that the color distribution is as claimed.
Expert Solution
This question has been solved!
Explore an expertly crafted, step-by-step solution for a thorough understanding of key concepts.

This is a popular solution

Trending nowThis is a popular solution!

Step by stepSolved in 4 steps with 1 images

Knowledge Booster


Learn more about
Need a deep-dive on the concept behind this application? Look no further. Learn more about this topic, statistics and related others by exploring similar questions and additional content below.Similar questions
- siundar u utviu. 39. Consider these values a sample: 7, 2, 6, 2, and 3.arrow_forward20 computer screens were randomly selected from a large collection of computer screens in a company’s warehouse. These 20 computer screens are referred to as the: test statistic. parameter. population. sample.arrow_forwardConsider a sample with data values of 10, 20, 15, 18, and 11. Compute the range and interquartile range.arrow_forward
- About 79 % of college students support a "smoke free" campus initiative. What is the minimum sample size required so that the sampling distribution of the sample proportion is approximately normal? n = 51 n = 16 n = 48 n = 96arrow_forwardThe College Board provided comparisons of Scholastic Aptitude Test (SAT) scores based on the highest level of education attained by the test taker's parents. A research hypothesis was that students whose parents had attained a higher level of education would on average score higher on the SAT. The overall mean SAT math score was 514. SAT math scores for independent samples of students follow. The first sample shows the SAT math test scores for students whose parents are college graduates with a bachelor's degree. The second sample shows the SAT math test scores for students whose parents are high school graduates but do not have a college degree. College Grads 485 487 518 517 650 542 570 426 566 499 588 562 497 448 592 453 High School Grads 442 492 580 478 479 425 486 485 528 390 524 535 (b) What is the point estimate of the difference between the means for the two populations? (c) Find the value of the test statistic. (Round your answer…arrow_forwardConsider a sample with data values of 10, 20, 15, 16, and 18. Compute the range and interquartile range.arrow_forward
- Fund the mean and variance for the following sample data 12, 16, 11, 23, 9, 17, 12, 25arrow_forward1. Find the mean for the given sample data. 2, 5, 9, 13, 17, 20arrow_forwardConsider a sample with data values of 27, 25, 20, 15, 30, 34, 28, and 25. Compute the 19th, 24th, 65th, and 75th percentiles. If needed, round your answers to two decimal digits. Percentile Value 19% 24% 65% 75%arrow_forward
- A veterinarian is interested in researching the proportion of men and women cat owners and believes that the proportion of men cat owners is significantly different than the proportion of women cat owners. The veterinarian decides to obtain two independent samples of men and women cat owners and finds from one sample of 60 men, 35% owned cats. In the second sample of 80 women, 60% owned cats. Test the veterinarian's belief at the a = significance level. Preliminary: a. Is it safe to assume that nmen 5% of all men and nwomen 5% of all women? 0.05 Yes No b. Verify np (1 - p) ≥ 10. Round your answer to one decimal place. np (1 − p) nmen = nwomen (1 - p) Test the claim: = a. Determine the null and alternative hypotheses. Ho: Pmen? Pwomen Ha Pmen ? Pwomen b. The hypothesis test is right-tailed left-tailed two-tailed c. Determine the test statistic. Round to two decimal places. z = d. Find the p-value. Round to four decimal places. p-value e. Make a decision. O Fail to reject the null…arrow_forwardConsider the following sets of sample data: A: $2.48 , $1.02 , $1.82 , $2.24 , $2.43 , $2.63 , $1.81 , $2.18 , $1.58 , $1.73 , $1.37 , $1.18 , $1.53 , $1.06 B: 97 , 134 , 139 , 126 , 120 , 143 , 141 , 142 , 113 , 99 , 129 Step 1 of 2: For each of the above sets of sample data, calculate the coefficient of variation, CV. Round to one decimal place. what is the cv for data set a and barrow_forwardConsider the relationship between p-values and significance levels. a. Explain why a value of z-statistic that is significant at the 1% level in a one-sided test is always significant at the 5% level. b. Explain why the reverse is not true. If something is significant at the 5% level in a one-sided test it is not necessarily significant at the 1% level.arrow_forward
arrow_back_ios
SEE MORE QUESTIONS
arrow_forward_ios
Recommended textbooks for you
- MATLAB: An Introduction with ApplicationsStatisticsISBN:9781119256830Author:Amos GilatPublisher:John Wiley & Sons Inc
 Probability and Statistics for Engineering and th...StatisticsISBN:9781305251809Author:Jay L. DevorePublisher:Cengage Learning
 Statistics for The Behavioral Sciences (MindTap C...StatisticsISBN:9781305504912Author:Frederick J Gravetter, Larry B. WallnauPublisher:Cengage Learning
  Elementary Statistics: Picturing the World (7th E...StatisticsISBN:9780134683416Author:Ron Larson, Betsy FarberPublisher:PEARSON
 The Basic Practice of StatisticsStatisticsISBN:9781319042578Author:David S. Moore, William I. Notz, Michael A. FlignerPublisher:W. H. Freeman
 Introduction to the Practice of StatisticsStatisticsISBN:9781319013387Author:David S. Moore, George P. McCabe, Bruce A. CraigPublisher:W. H. Freeman
MATLAB: An Introduction with Applications
Statistics
ISBN:9781119256830
Author:Amos Gilat
Publisher:John Wiley & Sons Inc
Probability and Statistics for Engineering and th...
Statistics
ISBN:9781305251809
Author:Jay L. Devore
Publisher:Cengage Learning
Statistics for The Behavioral Sciences (MindTap C...
Statistics
ISBN:9781305504912
Author:Frederick J Gravetter, Larry B. Wallnau
Publisher:Cengage Learning
Elementary Statistics: Picturing the World (7th E...
Statistics
ISBN:9780134683416
Author:Ron Larson, Betsy Farber
Publisher:PEARSON
The Basic Practice of Statistics
Statistics
ISBN:9781319042578
Author:David S. Moore, William I. Notz, Michael A. Fligner
Publisher:W. H. Freeman
Introduction to the Practice of Statistics
Statistics
ISBN:9781319013387
Author:David S. Moore, George P. McCabe, Bruce A. Craig
Publisher:W. H. Freeman