
MATLAB: An Introduction with Applications
6th Edition
ISBN: 9781119256830
Author: Amos Gilat
Publisher: John Wiley & Sons Inc
expand_more
expand_more
format_list_bulleted
Related questions
Concept explainers
Topic Video
Question
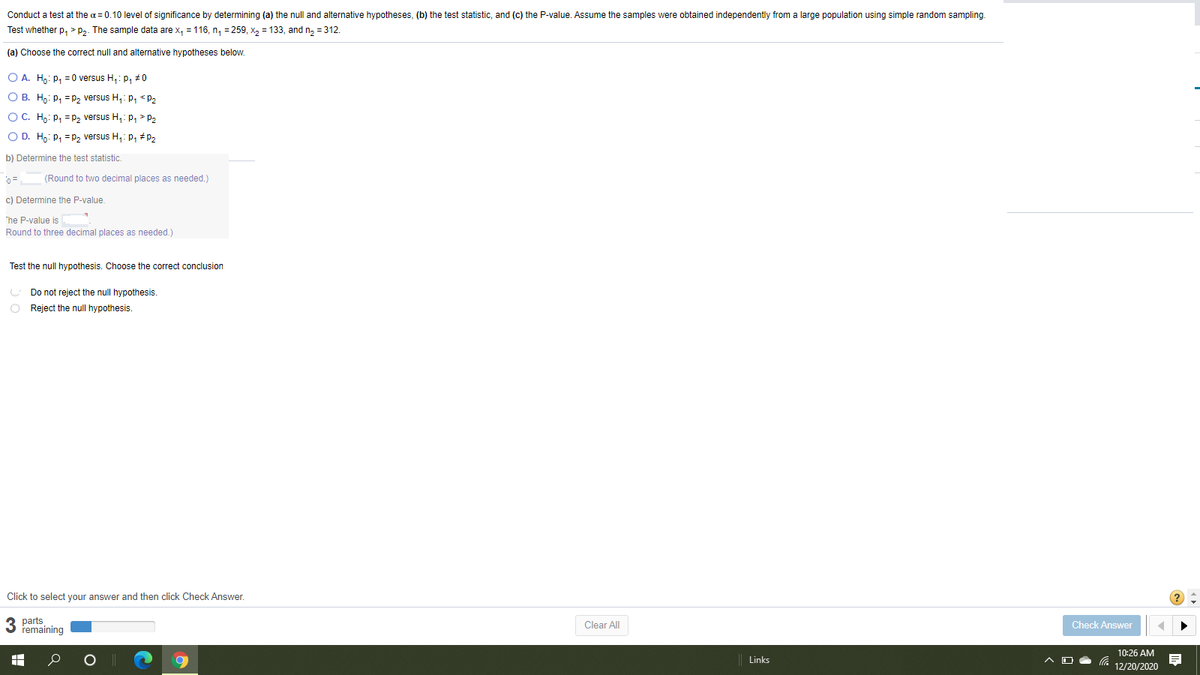

Transcribed Image Text:Conduct a test at the a = 0.10 level of significance by determining (a) the null and alternative hypotheses, (b) the test statistic, and (c) the P-value. Assume the samples were obtained independently from a large population using simple random sampling.
Test whether p, > p3. The sample data are x, = 116, n, = 259, x, = 133, and n, = 312.
(a) Choose the correct null and alternative hypotheses below.
O A. Ho: P, = 0 versus H,: p, #0
O B. Ho: P, =p, versus H,: p, < P2
OC. Ho: P, =P2 versus H,: p, > P2
O D. Ho: p, =p2 versus H,: p, #P2
b) Determine the test statistic.
(Round to two decimal places as needed.)
c) Determine the P-value.
The P-value is
Round to three decimal places as needed.)
Test the null hypothesis. Choose the correct conclusion
U Do not reject the null hypothesis.
O Reject the null hypothesis.
Click to select your answer and then click Check Answer.
3 parts
remaining
Clear All
Check Answer
10:26 AM
Links
12/20/2020
Expert Solution
This question has been solved!
Explore an expertly crafted, step-by-step solution for a thorough understanding of key concepts.

This is a popular solution

Trending nowThis is a popular solution!

Step by stepSolved in 2 steps with 3 images

Knowledge Booster


Learn more about
Need a deep-dive on the concept behind this application? Look no further. Learn more about this topic, statistics and related others by exploring similar questions and additional content below.Similar questions
- In a 2-sample z-test for two proportions, you find the following: X1 = 24 n1 = 200 X2 = 17 n2 = 150 You decide to run a test for which the alternative hypothesis is H1: p1 > p2. Find the appropriate test statistic for the testarrow_forwardIn a simple random sample size of 89, there were 40 individuals in the category of interest. It is desired to test —- H0:P=0.46 VS H1:Parrow_forwardA state-by-state survey found that the proportions of adults who are smokers in state A and state B were 22.9% and 19.3%, respectively. (Suppose the number of respondents from each state was 3000.) At a = 0.05, can you support the claim that the proportion of adults who are smokers is lower in state A than in state B? Assume the random samples are independent. Complete parts (a) through (e). (a) Identify the claim and state Ho and Ha. The claim is "the proportion of adults who are smokers in state A is the proportion of adults who are smokers in state B." Let p, and p2 be the two population proportions. State H, and Ha. Choose the correct answer below. O A. Ho: P1 = P2 Hạ: P1 # P2 O B. Ho: P1 P2 Ha: P1 SP2 D. Ho: P1 sP2 F. Ho: P1 2 P2 Ha: P1 > P2 Ha: P1 1.96 ОС. z2 -1.64 D. z 1.64 E. z - 1.96 (c) Find the standardized test statistic.arrow_forward
- test statistic, and (c) the P-value. Assume the samples were obtained independently from a large population using simple random sampling. Test whether p₁>P2. The sample data are x₁ = 116, n₁ =249, x₂ = 138, and n₂ = 306. (a) Choose the correct null and alternative hypotheses below. OA. Ho: P₁ P₂ versus H₁: P₁ P2 B. Ho: P₁ = 0 versus H₁: P₁ #0 W OC. Ho: P₁ = P₂ versus H₁: P₁ P₂ OD. Ho: P₁ P2 versus H₁: P₁ P₂ w an example Get more help Clear all 17 e Check answer 6:51 PM 3/2/2024 C Garrow_forwardOne sample has n=7 and SS=35 and a second sample has n =17 and SS =45. What is the pooled variance for these two samples?arrow_forwardWhat is the test statistic and the p- value ?arrow_forward
- In each situation, find the value of the t-statistic for the sample mean x and give the value of degrees of freedom (df). (a) x = 6, µ = 12, o = 24, n = 25 t = df = (b) x = 18, u = 12, o = 24, n = 25 t = df =arrow_forwardConduct a test at the a = 0.10 level of significance by determining (a) the null and alternative hypotheses, (b) the test statistic, and (c) the P-value. Assume the samples were obtained independently from a large population using simple random sampling. Test whether p, > p3. The sample data are x, = 125, n, = 251, x, = 135, and n, = 312. (a) Choose the correct null and alternative hypotheses below. (b) Determine the test statistic. Zo = (Round to two decimal places as needed.) O A. Ho: p, =p, versus H,: p, > P2 O B. Ho: p, =0 versus H,: p, #0 Test the null hypothesis. Choose the correct conclusion (c) Determine the P-value. The P-value is O C. Ho: P, =p2 versus H,: p,arrow_forwardGot stuck, and wasn’t sure what to do.arrow_forward
- When applying the rank-sum test, do you need independent or dependent samples? Neither is required, but we prefer dependent samples. Dependent samples are required. Neither is required,but we prefer independent samples. Independent samples are required.arrow_forwardConduct a test at the α=0.01 level of significance by determining (a) the null and alternative hypotheses, (b) the test statistic, and (c) the P-value. Assume the samples were obtained independently from a large population using simple random sampling. Test whether p1>p2. The sample data are x1=124, n1=243, x2=139, and n2=312.arrow_forwardOpposing a random sample of size and equal 16A sample average of 185 it is observed the P value of the sample statistic isarrow_forward
arrow_back_ios
SEE MORE QUESTIONS
arrow_forward_ios
Recommended textbooks for you
- MATLAB: An Introduction with ApplicationsStatisticsISBN:9781119256830Author:Amos GilatPublisher:John Wiley & Sons Inc
 Probability and Statistics for Engineering and th...StatisticsISBN:9781305251809Author:Jay L. DevorePublisher:Cengage Learning
 Statistics for The Behavioral Sciences (MindTap C...StatisticsISBN:9781305504912Author:Frederick J Gravetter, Larry B. WallnauPublisher:Cengage Learning
  Elementary Statistics: Picturing the World (7th E...StatisticsISBN:9780134683416Author:Ron Larson, Betsy FarberPublisher:PEARSON
 The Basic Practice of StatisticsStatisticsISBN:9781319042578Author:David S. Moore, William I. Notz, Michael A. FlignerPublisher:W. H. Freeman
 Introduction to the Practice of StatisticsStatisticsISBN:9781319013387Author:David S. Moore, George P. McCabe, Bruce A. CraigPublisher:W. H. Freeman
MATLAB: An Introduction with Applications
Statistics
ISBN:9781119256830
Author:Amos Gilat
Publisher:John Wiley & Sons Inc
Probability and Statistics for Engineering and th...
Statistics
ISBN:9781305251809
Author:Jay L. Devore
Publisher:Cengage Learning
Statistics for The Behavioral Sciences (MindTap C...
Statistics
ISBN:9781305504912
Author:Frederick J Gravetter, Larry B. Wallnau
Publisher:Cengage Learning
Elementary Statistics: Picturing the World (7th E...
Statistics
ISBN:9780134683416
Author:Ron Larson, Betsy Farber
Publisher:PEARSON
The Basic Practice of Statistics
Statistics
ISBN:9781319042578
Author:David S. Moore, William I. Notz, Michael A. Fligner
Publisher:W. H. Freeman
Introduction to the Practice of Statistics
Statistics
ISBN:9781319013387
Author:David S. Moore, George P. McCabe, Bruce A. Craig
Publisher:W. H. Freeman