Practical Management Science
6th Edition
ISBN: 9781337406659
Author: WINSTON, Wayne L.
Publisher: Cengage,
expand_more
expand_more
format_list_bulleted
Concept explainers
Question
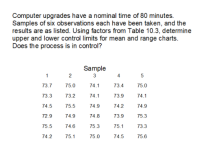
Expert Solution
This question has been solved!
Explore an expertly crafted, step-by-step solution for a thorough understanding of key concepts.
This is a popular solution
Trending nowThis is a popular solution!
Step by stepSolved in 5 steps with 4 images
Knowledge Booster
Learn more about
Need a deep-dive on the concept behind this application? Look no further. Learn more about this topic, operations-management and related others by exploring similar questions and additional content below.Similar questions
- Administering new bank accounts is intended to average 15 minutes each. Five samples of four observations each have been taken. Use the sample data in concurrence with Table 2.3 to create upper and lower control limits for both a mean chart and a range chart. Do results propose that the procedure is in control? Sample 1 Sample 2 Sample 3 Sample 4 Sample 5 11.2 11.3 10.7 10.9 10.8 10.9 10.8 10.9 11.3 11.2 10.8 10.9 10.9 11.1 11.3 11.1 11.4 11.1 11.5 10.7 Total: 44 44.4 43.6 44.8 44arrow_forwardQ4) Ten samples of size four were taken from a process, and their weights measured. The sample averages and sample ranges are in the following table. Construct and plot an x-bar and R-chart using these data. Is the process in control? Sample Mean Range 1 20.01 0.45 2 19.98 0.67 3 20.25 0.30 4 19.90 0.30 5 20.35 0.36 6 19.23 0.49 7 20.01 0.53 8 19.98 0.40 9 20.56 0.95 10 19.97 0.79arrow_forwardCheckout time at a supermarket is monitored using a mean and a range chart. Six samples of n = 20 observations have been obtained and the sample means and ranges computed:arrow_forward
- Chocolate, Inc. manufactures 4 ounce chocolate bars. Random samples of size four were taken and weighed. Eight hours of observation provided the following data. Sample Mean Range 1 3.96 0.13 2 4.03 0.16 3 3.97 0.16 4 4.14 0.16 5 3.88 0.11 6 4.03 0.18 7 4.04 0.18 8 4.07 0.14 (a) Determine the upper and lower control limits for the x chart. (Round your answers to four decimal places.) UCL=?? LCL=?? (b) Determine the upper and lower control limits for the R chart. (Round your answers to four decimal places.) UCL=?? LCL=??arrow_forwardGiven the following data from 7 days. Compute, CL, UCL, and LCL of Control Charts for the following data. Day Sample Values (Group Sample Size = n = 4) 1 22 24 23 26 2 25 25 28 26 3 24 25 27 27 4 27 23 29 28 5 26 27 23 25 6 27 25 23 28 7 27 28 28 22arrow_forwardWhy is it important to prove that a process is proven capable before developing statistical control limits (i.e., SPC charts)?arrow_forward
- x and R Control Charts A cereal manufacturer fills cereal boxes to an averageweight of 20 ounces and has an average range of 2 ounces when the filling process is in control. A sample size of 10 boxes is used in evaluating the process.a. What are the CL, UCL, and LCL for the x and R charts?b. A sample with the following 10 measurements was just taken: 20, 21, 19, 18, 19, 21,22, 20, 20, 19. Is the process still in control?arrow_forward5-3 Sample data:Mean (Microns) (N=4) Minimum Maximum3.821 3.764 3.9993.946 3.804 4.2514.049 4.039 4.4543.793 3.779 3.9233.635 3.534 4.0684.046 3.578 4.5043.569 2.974 3.9084.084 3.779 5.6673.414 2.806 4.2565.319 5.168 6.3464.096 4.092 4.2234.108 3.957 4.3084.037 3.982 4.3933.789 3.691 3.8534.066 4.023 4.269 Constants: Sample Size N A2 D3 D4 2 1.88 0 3.27 3 1.02 0 2.57 4 0.73 0 2.28 5 0.58 0 2.11 6 0.48 0 2.00 7 0.42 0.08 1.92 8 0.37 0.14 1.86 9 0.34 0.18 1.82 10 0.31 0.22 1.78 11 0.29 0.26 1.74 12 0.27 0.28 1.72arrow_forwardDevelop a p chart with 3 sigma control limits and evaluate whether the process is in statical controlarrow_forward
- 5-4 Sample data:Mean (Microns) (N=4) Minimum Maximum3.821 3.764 3.9993.946 3.804 4.2514.049 4.039 4.4543.793 3.779 3.9233.635 3.534 4.0684.046 3.578 4.5043.569 2.974 3.9084.084 3.779 5.6673.414 2.806 4.2565.319 5.168 6.3464.096 4.092 4.2234.108 3.957 4.3084.037 3.982 4.3933.789 3.691 3.8534.066 4.023 4.269 Constants: Sample Size N A2 D3 D4 2 1.88 0 3.27 3 1.02 0 2.57 4 0.73 0 2.28 5 0.58 0 2.11 6 0.48 0 2.00 7 0.42 0.08 1.92 8 0.37 0.14 1.86 9 0.34 0.18 1.82 10 0.31 0.22 1.78 11 0.29 0.26 1.74 12 0.27 0.28 1.72arrow_forwardA process that is assumed to be in control with limits of 85 3 had sample averages for the x-bar chart of the following: 87.1,87,87.2,89,90,88.5,89.5, and 88. Which of the following statement below are correct? O a. Process mean is out-of-control Ob. Process mean is in-control 1x OG. Not enough information to determine Od. Noneis correctarrow_forwardWaiting time (minute) at a Tim Horton is monitored using sample mean and range control charts. Six samples of n = 10 observations have been obtained and the sample means and ranges computed (in minutes): Determine the upper and lower limits for sample mean and range control charts. Is the process in control? Draw appropriate control chart (s).arrow_forward
arrow_back_ios
SEE MORE QUESTIONS
arrow_forward_ios
Recommended textbooks for you
- Practical Management ScienceOperations ManagementISBN:9781337406659Author:WINSTON, Wayne L.Publisher:Cengage,Operations ManagementOperations ManagementISBN:9781259667473Author:William J StevensonPublisher:McGraw-Hill EducationOperations and Supply Chain Management (Mcgraw-hi...Operations ManagementISBN:9781259666100Author:F. Robert Jacobs, Richard B ChasePublisher:McGraw-Hill Education
- Purchasing and Supply Chain ManagementOperations ManagementISBN:9781285869681Author:Robert M. Monczka, Robert B. Handfield, Larry C. Giunipero, James L. PattersonPublisher:Cengage LearningProduction and Operations Analysis, Seventh Editi...Operations ManagementISBN:9781478623069Author:Steven Nahmias, Tava Lennon OlsenPublisher:Waveland Press, Inc.
Practical Management Science
Operations Management
ISBN:9781337406659
Author:WINSTON, Wayne L.
Publisher:Cengage,
Operations Management
ISBN:9781259667473
Author:William J Stevenson
Publisher:McGraw-Hill Education
Operations and Supply Chain Management (Mcgraw-hi...
Operations Management
ISBN:9781259666100
Author:F. Robert Jacobs, Richard B Chase
Publisher:McGraw-Hill Education
Purchasing and Supply Chain Management
Operations Management
ISBN:9781285869681
Author:Robert M. Monczka, Robert B. Handfield, Larry C. Giunipero, James L. Patterson
Publisher:Cengage Learning
Production and Operations Analysis, Seventh Editi...
Operations Management
ISBN:9781478623069
Author:Steven Nahmias, Tava Lennon Olsen
Publisher:Waveland Press, Inc.