MATLAB: An Introduction with Applications
6th Edition
ISBN: 9781119256830
Author: Amos Gilat
Publisher: John Wiley & Sons Inc
expand_more
expand_more
format_list_bulleted
Concept explainers
Topic Video
Question
Computer hard drives must rotate in a balanced way and away from level is called pitch.
Samples are taken regularly from production and each disk in the sample is placed in test equipment that results in a pitch measurement.
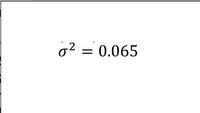
From various samples it is concluded that the population is normal. The variance = image 1 when the process is in control.
A sample of 10 is collected each week. The process will be declared out of control if the sample variance exceeds 0.122
What is the

Transcribed Image Text:o² = 0.065
%D
Expert Solution
This question has been solved!
Explore an expertly crafted, step-by-step solution for a thorough understanding of key concepts.
Step by stepSolved in 2 steps with 1 images

Knowledge Booster
Learn more about
Need a deep-dive on the concept behind this application? Look no further. Learn more about this topic, statistics and related others by exploring similar questions and additional content below.Similar questions
- You are testing the claim that having lights on at night increases weight gain (abstract). A sample of 10 mice lived in an environment with bright light on all of the time and 8 mice who lived in an environment with a normal light/dark cycle is given below. Test the claim using a 10% level of significance. Assume the population variances are unequal and that the weight changes are normally distributed. Give answers to 3 decimal places. Data available at StatKey, choose Mice Wgt Gain-2e data set Light (x₁) 1.71 4.67 4.99 5.33 5.43 6.94 7.15 9.17 10.26 11.67 What are the correct hypotheses? Note this may view better in full screen mode. Select the correct symbols in the order they appear in the problem. Ho: Select an answer ? V Select an answer V Ha: Select an answer ✓ Based on the hypotheses, find the following: Test Statistic = Dark (₂) 2.27 2.53 2.83 4 4.21 4.6 5.95 6.52 p-value = ? V Select an answer V (Hint: difference in means from Ha) The correct decision is to Select an answer…arrow_forwardWhen Freshman 15 The term "Freshman 15" refers to the claim that college students typically gain 15 lb during their freshman year at college. Assume that the amounts of weight that male college students gain during their freshman year are normally distributed with a mean of 2.6 lb and a standard deviation of 10.8 1b (based on Data Set 13 "Freshman 15"). Find the probability that a randomly selected male college student gains 15 lb or more during his freshman year. What does the result suggest about the claim of the "Freshman 15"?arrow_forwardA researcher wants to measure average cardiovascular health of university students and compare those scores to the average scores in the general population. Assuming that population variance is known, what statistical test is most appropriate for this study? independent-samples t-test single-sample t-test z-test for sample mean related-samples t-testarrow_forward
- You are testing the claim that having lights on at night increases weight gain (abstract). A sample of 10 mice lived in an environment with bright light on all of the time and 8 mice who lived in an environment with a normal light/dark cycle is given below. Test the claim using a 2% level of significance. Assume the population variances are unequal and that the weight changes are normally distributed. Give answers to 3 decimal places. Data available at StatKey, choose Mice Wgt Gain-2e data set Light (1) 1.71 4.67 4.99 5.33 5.43 6.94 7.15 9.17 10.26 11.67 What are the correct hypotheses? Note this may view better in full screen mode. Select the correct symbols in the order they appear in the problem. Ho: ₁ Test Statistic = Dark (₂) 2.27 2.53 2.83 4 4.21 4.6 5.95 6.52 Ha: ₁ Based on the hypotheses, find the following: p-value = = V Select an answer ✓ Select an answer (Hint: difference in means from H₂) The correct decision is to fail to reject the null hypothesis The correct summary…arrow_forwardSuppose a researcher pbserves a population of 12 people and computes SS=204. What is the variance? What is the standard deviation?arrow_forwardWhen you take samples of size n - 100 from a normally distributed population, what will likely be the shape of the distribution of sample means? Right Skewed Left Skewed Normalarrow_forward
arrow_back_ios
arrow_forward_ios
Recommended textbooks for you
 MATLAB: An Introduction with ApplicationsStatisticsISBN:9781119256830Author:Amos GilatPublisher:John Wiley & Sons Inc
 Probability and Statistics for Engineering and th...StatisticsISBN:9781305251809Author:Jay L. DevorePublisher:Cengage Learning
 Statistics for The Behavioral Sciences (MindTap C...StatisticsISBN:9781305504912Author:Frederick J Gravetter, Larry B. WallnauPublisher:Cengage Learning
 Elementary Statistics: Picturing the World (7th E...StatisticsISBN:9780134683416Author:Ron Larson, Betsy FarberPublisher:PEARSON
 The Basic Practice of StatisticsStatisticsISBN:9781319042578Author:David S. Moore, William I. Notz, Michael A. FlignerPublisher:W. H. Freeman
 Introduction to the Practice of StatisticsStatisticsISBN:9781319013387Author:David S. Moore, George P. McCabe, Bruce A. CraigPublisher:W. H. Freeman

MATLAB: An Introduction with Applications
Statistics
ISBN:9781119256830
Author:Amos Gilat
Publisher:John Wiley & Sons Inc

Probability and Statistics for Engineering and th...
Statistics
ISBN:9781305251809
Author:Jay L. Devore
Publisher:Cengage Learning

Statistics for The Behavioral Sciences (MindTap C...
Statistics
ISBN:9781305504912
Author:Frederick J Gravetter, Larry B. Wallnau
Publisher:Cengage Learning

Elementary Statistics: Picturing the World (7th E...
Statistics
ISBN:9780134683416
Author:Ron Larson, Betsy Farber
Publisher:PEARSON

The Basic Practice of Statistics
Statistics
ISBN:9781319042578
Author:David S. Moore, William I. Notz, Michael A. Fligner
Publisher:W. H. Freeman

Introduction to the Practice of Statistics
Statistics
ISBN:9781319013387
Author:David S. Moore, George P. McCabe, Bruce A. Craig
Publisher:W. H. Freeman