
MATLAB: An Introduction with Applications
6th Edition
ISBN: 9781119256830
Author: Amos Gilat
Publisher: John Wiley & Sons Inc
expand_more
expand_more
format_list_bulleted
Related questions
Topic Video
Question
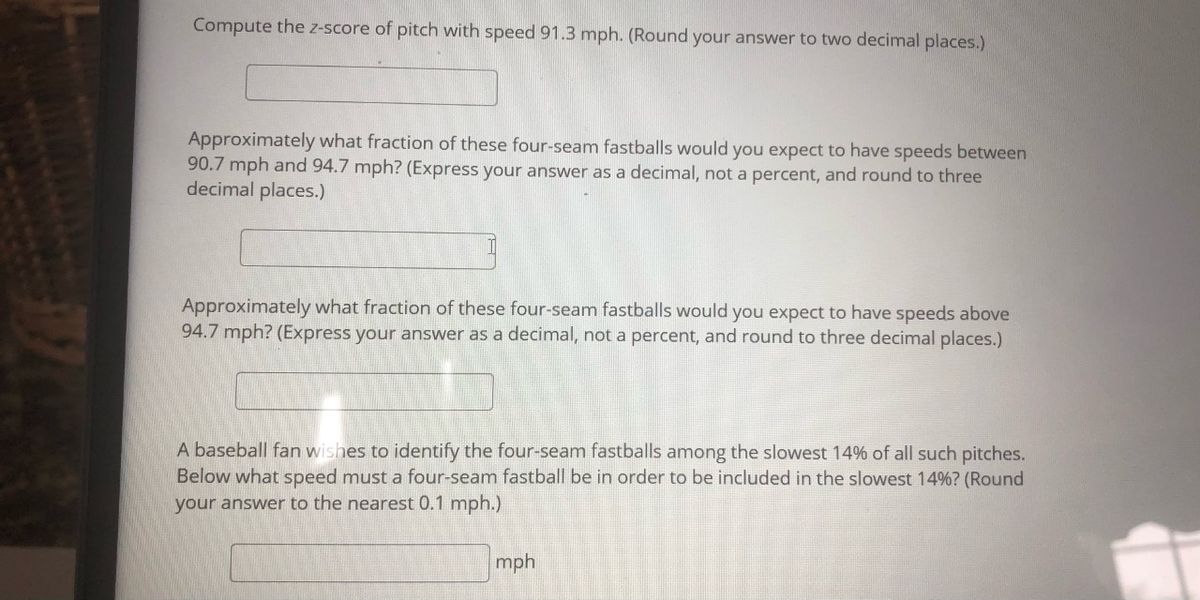

Transcribed Image Text:Compute the z-score of pitch with speed 91.3 mph. (Round your answer to two decimal places.)
Approximately what fraction of these four-seam fastballs would you expect to have speeds between
90.7 mph and 94.7 mph? (Express your answer as a decimal, not a percent, and round to three
decimal places.)
Approximately what fraction of these four-seam fastballs would you expect to have speeds above
94.7 mph? (Express your answer as a decimal, not a percent, and round to three decimal places.)
A baseball fan wishes to identify the four-seam fastballs among the slowest 14% of all such pitches.
Below what speed must a four-seam fastball be in order to be included in the slowest 14%? (Round
your answer to the nearest 0.1 mph.)
mph

Transcribed Image Text:Major League Baseball now records information about every pitch thrown in every game of
season. Statistician Jim Albert compiled data about every pitch thrown by 20 starting pitchers during
the 2009 MLB season. The data set included the type of pitch thrown (curveball, changeup, slider,
etc.) as well as the speed of the ball-as it left the pitcher's hand. A histogram of speeds for all 30,740
four-seam fastballs thrown by these pitchers during the 2009 season is shown below, from which
we can see that the speeds of these fastballs follow a Normal model with mean u = 92.12 mph and a
standard deviation of o = 2.43 mph.
every
85
90
95
100
speed (mph)
counts
Expert Solution
This question has been solved!
Explore an expertly crafted, step-by-step solution for a thorough understanding of key concepts.

This is a popular solution

Trending nowThis is a popular solution!

Step by stepSolved in 2 steps

Knowledge Booster


Learn more about
Need a deep-dive on the concept behind this application? Look no further. Learn more about this topic, statistics and related others by exploring similar questions and additional content below.Similar questions
- 2. Kenneth threw a basketball toward the hoop. At the time the ball left his hands it was travelling at a rate of 8 meters per second. a. How many meters above his hands was the ball after i. 1 second ii. 0.5 seconds iii. 1.5 seconds b. After 0.5 seconds, was the ball on its way up or down? Justify your answer. c. i. How many meters was the ball above his hands after 0.2 seconds? ii. If the ball left Kenneth's hands at a distance of 3 meters above the floor, how far from the floor will the ball be after 0.2 seconds? d. Given that the ball left Kenneth's hands 3 meters above the floor, if Kenneth misses the shot, how long will it take the ball to hit the floor? e. The ceiling of the gym has beams at a height of 15 meters above the floor. Can the ball possibly touch one of these beams? Justify your answer.arrow_forwardA floor plan has a 56 inches: 1 inch scale. On the drawing, one of the rooms measures 2 3/8 inches by 1 5/8 inches. Show answers to the nearest .01 The actucal dimension would be _______ feet by: _______ feet. The area of the room would be _____ square feet.arrow_forwardThe accompanying table lists 18 of the largest companies in the world ranked by their market capitalization (in billions of dollars). A company's market capitalization is defined as the number of its shares multiples by the price per share. Complete parts a throuah d below. a. Determine the coefficient of variation. Data Table coefficient of variation = (Round to two decimal places as needed.) b. Calculate the z-score for a company with a market capitalization of $250 billion. Company Market Cap ($ billions) Z-score = (Round to two decimal places as needed.) Wells Fargo 274.4 Nestle 229.5 c. Test to determine if the empirical rule holds true by determining the percentage of observations that fall within tone standard deviation from the mean. ExxonMobil 343.2 What is the percentage of observations that fall within tone standard deviation from the mean? ATandT 249.3 JPMorgan Chase Alphabet 306.6 % of the observations fall within t one standard deviation from the mean. 579.5 (Round to the…arrow_forward
- The mall has a set of data with employee age (X) and the corresponding number of annual on-the-job-accidents(Y). Analysis on the set finds that the regression equation is Y=100-3X. What is the likely number of accidents for someone aged 30? 97 100 10 none of the abovearrow_forwardHW TWENTY Options for part (b) a. "Z" b. "t" c. "Chi-square" d. "F"arrow_forwardRound every calculation to 2 decimal points unless the specific question asks for something different. Show answers as decimals and not percents or fractions.arrow_forward
- 5.) 35 students were enrolled on the first day of a English class. By mid-semester, there were only 20 students left. What was the percentage decrease in enrolled students from the first day of class to the mid semester? Round your answer to one decimal place.arrow_forwardLet TailTwo-Tail Right Tail samples - 1000 mean = 0.150 100 std. error - 0.027 80 60 40 20 0.06 0.08 0.10 0.12 0.14 0.16 0.18 0.20 0.22 0.24 0.15arrow_forwardCoal is carried from a mine in West Virginia to a power plant in New York in hopper cars on a long train. The autoratic hopper car loader is set to put 57 tons of coal ints each car. The actual weights of coal loaded d deviation o = 1.1 ton.arrow_forward
- The U.S. Weather Bureau has a station on Mauna Loa in Hawaii that has measured carbon dioxide levels since 1959. At that time, there were 313 parts per million of carbon dioxide in the atmosphere. In 2005, the figure was 383 parts per million. What is the absolute change in carbon dioxide levels: parts per million What is the relative change in carbon dioxide levels: between 0 and 100, not a decimal between 0 and 1. Round to ONE decimal place.) % (Give your answer as a percentarrow_forwardFind the z-score that best satisfies the condition. 10% of the total area is to the left of z. 2=0 (Round to the nearest hundredth.)arrow_forwardwhat is ther interquartile range of the data shown in the box plot above?arrow_forward
arrow_back_ios
SEE MORE QUESTIONS
arrow_forward_ios
Recommended textbooks for you
- MATLAB: An Introduction with ApplicationsStatisticsISBN:9781119256830Author:Amos GilatPublisher:John Wiley & Sons Inc
 Probability and Statistics for Engineering and th...StatisticsISBN:9781305251809Author:Jay L. DevorePublisher:Cengage Learning
 Statistics for The Behavioral Sciences (MindTap C...StatisticsISBN:9781305504912Author:Frederick J Gravetter, Larry B. WallnauPublisher:Cengage Learning
  Elementary Statistics: Picturing the World (7th E...StatisticsISBN:9780134683416Author:Ron Larson, Betsy FarberPublisher:PEARSON
 The Basic Practice of StatisticsStatisticsISBN:9781319042578Author:David S. Moore, William I. Notz, Michael A. FlignerPublisher:W. H. Freeman
 Introduction to the Practice of StatisticsStatisticsISBN:9781319013387Author:David S. Moore, George P. McCabe, Bruce A. CraigPublisher:W. H. Freeman
MATLAB: An Introduction with Applications
Statistics
ISBN:9781119256830
Author:Amos Gilat
Publisher:John Wiley & Sons Inc
Probability and Statistics for Engineering and th...
Statistics
ISBN:9781305251809
Author:Jay L. Devore
Publisher:Cengage Learning
Statistics for The Behavioral Sciences (MindTap C...
Statistics
ISBN:9781305504912
Author:Frederick J Gravetter, Larry B. Wallnau
Publisher:Cengage Learning
Elementary Statistics: Picturing the World (7th E...
Statistics
ISBN:9780134683416
Author:Ron Larson, Betsy Farber
Publisher:PEARSON
The Basic Practice of Statistics
Statistics
ISBN:9781319042578
Author:David S. Moore, William I. Notz, Michael A. Fligner
Publisher:W. H. Freeman
Introduction to the Practice of Statistics
Statistics
ISBN:9781319013387
Author:David S. Moore, George P. McCabe, Bruce A. Craig
Publisher:W. H. Freeman