MATLAB: An Introduction with Applications
6th Edition
ISBN: 9781119256830
Author: Amos Gilat
Publisher: John Wiley & Sons Inc
expand_more
expand_more
format_list_bulleted
Question

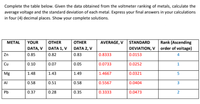
Transcribed Image Text:Complete the table below. Given the data obtained from the voltmeter ranking of metals, calculate the
average voltage and the standard deviation of each metal. Express your final answers in your calculations
in four (4) decimal places. Show your complete solutions.
Rank (Ascending
DEVIATION, V order of voltage)
МЕTAL
YOUR
OTHER
ОТHER
AVERAGE, V
STANDARD
DATA, V DATA 1, V DATA 2, v
Zn
0.85
0.82
0.83
0.8333
0.0153
4
Cu
0.10
0.07
0.05
0.0733
0.0252
1
Mg
1.48
1.43
1.49
1.4667
0.0321
5
Al
0.58
0.51
0.58
0.5567
0.0404
3
Pb
0.37
0.28
0.35
0.3333
0.0473
2
Expert Solution
This question has been solved!
Explore an expertly crafted, step-by-step solution for a thorough understanding of key concepts.
This is a popular solution
Trending nowThis is a popular solution!
Step by stepSolved in 3 steps

Knowledge Booster
Similar questions
- Calculate the standard score of the given x value, x = 62, where u Round your answer to two decimal places. 69.3, o = 3.4. = Answer:arrow_forwardanswer only 8-94arrow_forwardA California lake has been stocked with rainbow trout. These trout have an average length of 24 inches, with a standard deviation of 3 inches. Someone goes fishing and catches a trout that is 26.25 inches long. Express the length of this trout in standard units, relative to all the trout that were used to stock the lake. Choose the answer below that is closest.arrow_forward
- In California, we need more rain to sustain the health of our natural environment, argriculture, and economic. A group of statistics students in Oxnard College recorded the amount of rain during 2016-2017 school year, measuring the intensity by the inches of rain, and the results were: Inches of Rain 2. 4 Frequency 4 4 3 1 3 The mean (T) rain intensity: inches (Please show your answer to 1 decimal place.) The median rain intensity: inches The mode rain intensity: inches (Please separate your answers by ',' in the bimodal situation. Enter DNE if there is no mode or if there are more than two modes.) Submit Question N 16 rch home ins prt sc delete 144arrow_forwardPlease help I need in 1 hour Thankyou so much.arrow_forwardDetermine whether the given value is a statistic or a parameter. A homeowner measured the voltage supplied to his home on 23 days of a given month, and the average (mean) value is 143.1 volts. Part 1 Choose the correct answer below. A. The given value is a statistic for the month because the data collected represent a population. B. The given value is a parameter for the month because the data collected represent a sample. C. The given value is a parameter for the month because the data collected represent a population. D. The given value is a statistic for the month because the data collected represent a sample.arrow_forward
- The blood pressure in millimeters was measured for a large sample of people. The average pressure is 140 mm, and the SD of the measurements is 20 mm. The histogram looks reasonably like a normal curv Use the normal curve to estimate the following percentages. Choose the answer that is closest to being correct. A 19.1% B 30.9% C 38.2% D 69.1% E 68.27% A The percentage of people with blood pressure between 130 and 150 mm. B The percentage of people with blood pressure between 140 and 150 mm. D The percentage of people with blood pressure over 150 mm.arrow_forwardDescribe about MEAN SQUARE (M S ) AND THE F RATIO.arrow_forwardLength of snowboards in a boardshop are normally distributed with a mean of 151.6 cm and a standard deviation of 0.7 cm. The figure below shows the distribution of the length of snowboards in a boardshop. Calculate the shaded area under the curve.Express your answer in decimal form accurate to at least two decimal places.arrow_forward
arrow_back_ios
arrow_forward_ios
Recommended textbooks for you
 MATLAB: An Introduction with ApplicationsStatisticsISBN:9781119256830Author:Amos GilatPublisher:John Wiley & Sons Inc
 Probability and Statistics for Engineering and th...StatisticsISBN:9781305251809Author:Jay L. DevorePublisher:Cengage Learning
 Statistics for The Behavioral Sciences (MindTap C...StatisticsISBN:9781305504912Author:Frederick J Gravetter, Larry B. WallnauPublisher:Cengage Learning
 Elementary Statistics: Picturing the World (7th E...StatisticsISBN:9780134683416Author:Ron Larson, Betsy FarberPublisher:PEARSON
 The Basic Practice of StatisticsStatisticsISBN:9781319042578Author:David S. Moore, William I. Notz, Michael A. FlignerPublisher:W. H. Freeman
 Introduction to the Practice of StatisticsStatisticsISBN:9781319013387Author:David S. Moore, George P. McCabe, Bruce A. CraigPublisher:W. H. Freeman

MATLAB: An Introduction with Applications
Statistics
ISBN:9781119256830
Author:Amos Gilat
Publisher:John Wiley & Sons Inc

Probability and Statistics for Engineering and th...
Statistics
ISBN:9781305251809
Author:Jay L. Devore
Publisher:Cengage Learning

Statistics for The Behavioral Sciences (MindTap C...
Statistics
ISBN:9781305504912
Author:Frederick J Gravetter, Larry B. Wallnau
Publisher:Cengage Learning

Elementary Statistics: Picturing the World (7th E...
Statistics
ISBN:9780134683416
Author:Ron Larson, Betsy Farber
Publisher:PEARSON

The Basic Practice of Statistics
Statistics
ISBN:9781319042578
Author:David S. Moore, William I. Notz, Michael A. Fligner
Publisher:W. H. Freeman

Introduction to the Practice of Statistics
Statistics
ISBN:9781319013387
Author:David S. Moore, George P. McCabe, Bruce A. Craig
Publisher:W. H. Freeman