A First Course in Probability (10th Edition)
10th Edition
ISBN: 9780134753119
Author: Sheldon Ross
Publisher: PEARSON
expand_more
expand_more
format_list_bulleted
Question

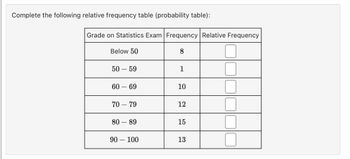
Transcribed Image Text:Complete the following relative frequency table (probability table):
Grade on Statistics Exam Frequency Relative Frequency
Below 50
8
50 - 59
60 - 69
70 - 79
80 - 89
90 - 100
1
10
12
15
13
Expert Solution
This question has been solved!
Explore an expertly crafted, step-by-step solution for a thorough understanding of key concepts.
This is a popular solution
Trending nowThis is a popular solution!
Step by stepSolved in 3 steps with 3 images

Knowledge Booster
Similar questions
- A variable of a finite population takes values 5, 7, or 8 and has the following frequency distribution: 5 7 8 frequency 25 40 60 Construct a probability histogram for variable X.arrow_forwardUsing the following two way frequency table, answer the following question: Have Been to Canada Have Not Been to Canada Have Been to Mexico 6 3 Have Not Been to Mexico 5 11 Find the probability that someone has NOT been to Mexico, given that they have been to Canada.arrow_forwardAmong fatal plane crashes that occurred during the past 70 years, 332 were due to pilot error, 63 were due to other human error, 265 were due to weather, 290 were due to mechanical problems, and 478 were due to sabotage. Construct the relative frequency distribution. What is the most serious threat to aviation safety, and can anything be done about it? Complete the relative frequency distribution below. Cause Relative Frequency Pilot error nothing% Other human error nothing% Weather nothing% Mechanical problems nothing% Sabotage nothing% (Round to one decimal place as needed.) What is the most serious threat to aviation safety, and can anything be done about it? A. Weather is the most serious threat to aviation safety. Weather monitoring systems could be improved. B. Mechanical problems are the most serious threat to aviation safety. New planes could be better engineered. C.…arrow_forward
- The following data represent the bachelor degrees of some CEO's who work in the NYC area a) Find the mode of the frequency distribution above:b) Find the population standard deviation manually. Show work. (Round values to one decimal place)arrow_forwardBelow is the frequency distribution of personal Computers on by students at a community college. Find the percent represented by sony computers brand Frequency dell 3,200 sony 5,200 hp 4,400 toshiba 6,600 asus. 3,600arrow_forwardThe following data represent the pulse rates (beats per minute) of nine students enrolled in a statistics course. Treat the nine students as a population. Complete parts (a) through (c). Student Perpectual Bempah Megan Brooks Jeff Honeycutt Clarice Jefferson Crystal Kurtenbach Janette Lantka Kevin McCarthy Tammy Ohm Kathy Wojdya Pulse 63 79 87 75 81 81 68 74 84 (a) Determine the population mean pulse. The population mean pulse is approximately 76.9 beats per minute. (Round to one decimal place as needed.) (b) Determine the sample mean pulse of the following two simple random samples of size 3. Sample 1: {Kathy, Kevin, Megan} Sample 2: (Perpectual, Megan, Jeff} The mean pulse of sample 1 is approximately (Round to one decimal place as needed.) A beats per minute.arrow_forward
- The following data represent the pulse rates (beats per minute) of nine students enrolled in a statistics course. Treat the nine students as a population. Complete parts (a) through (c). Student Perpectual Bempah Megan Brooks Jeff Honeycutt Clarice Jefferson Crystal Kurtenbach Janette Lantka Kevin McCarthy Tammy Ohm Kathy Wojdya Pulse 79 86 84 86 69 86 75 78 88 (a) Determine the population mean pulse. The population mean pulse is approximately (Round to one decimal place as needed.) (b) Determine the sample mean pulse of the following two simple random samples of size 3. Sample 1: (Megan, Kathy, Janette} Sample 2: (Tammy, Kevin, Crystal} The mean pulse of sample 1 is approximately (Round to one decimal place as needed.) The mean pulse of sample 2, is approximately (Round to one decimal place as needed.) The mean pulse rate of sample 1 beats per minute. The mean pulse rate of sample 2 beats per minute. (c) Determine if the means of samples 1 and 2 overestimate, underestimate, or are…arrow_forwardWhich of the following is the most appropriate type of chart for determining the number of observations at or below a specific value? Select one: a. A histogram. b. A pie chart. c. A time-series chart. d. A cumulative frequency ogive.arrow_forwardA stem and leaf diagram is used to: A) show the joint relationship between two variables. B) graph a joint frequency distribution. C) display the distribution of a quantitative variable. D) show relative cumulative frequency.arrow_forward
- Complete the following probability distribution table: X 6 34 35 81 88 PXXX) 0.2 0.26 0.26 0.14 Submit Question WE 4 R 5arrow_forwardBelow is a frequency distribution of the number of goals made in each game from a past season of the EFSC men's soccer team. What percent of their games did the team score O goals? number of goals in game 0 1 2 3 4 5 6 7 frequency 1 7 4 5 0 0 2arrow_forwardFill this table with the missing columns: Interval Frequency Probability Probability Density 1 3 13 4 - 6 15 7-9 19 9 - 11 14 11-16 17 - 26 3arrow_forward
arrow_back_ios
SEE MORE QUESTIONS
arrow_forward_ios
Recommended textbooks for you
 A First Course in Probability (10th Edition)ProbabilityISBN:9780134753119Author:Sheldon RossPublisher:PEARSON

A First Course in Probability (10th Edition)
Probability
ISBN:9780134753119
Author:Sheldon Ross
Publisher:PEARSON
