
MATLAB: An Introduction with Applications
6th Edition
ISBN: 9781119256830
Author: Amos Gilat
Publisher: John Wiley & Sons Inc
expand_more
expand_more
format_list_bulleted
Related questions
Question

Transcribed Image Text:This question: 1 point(s) possible
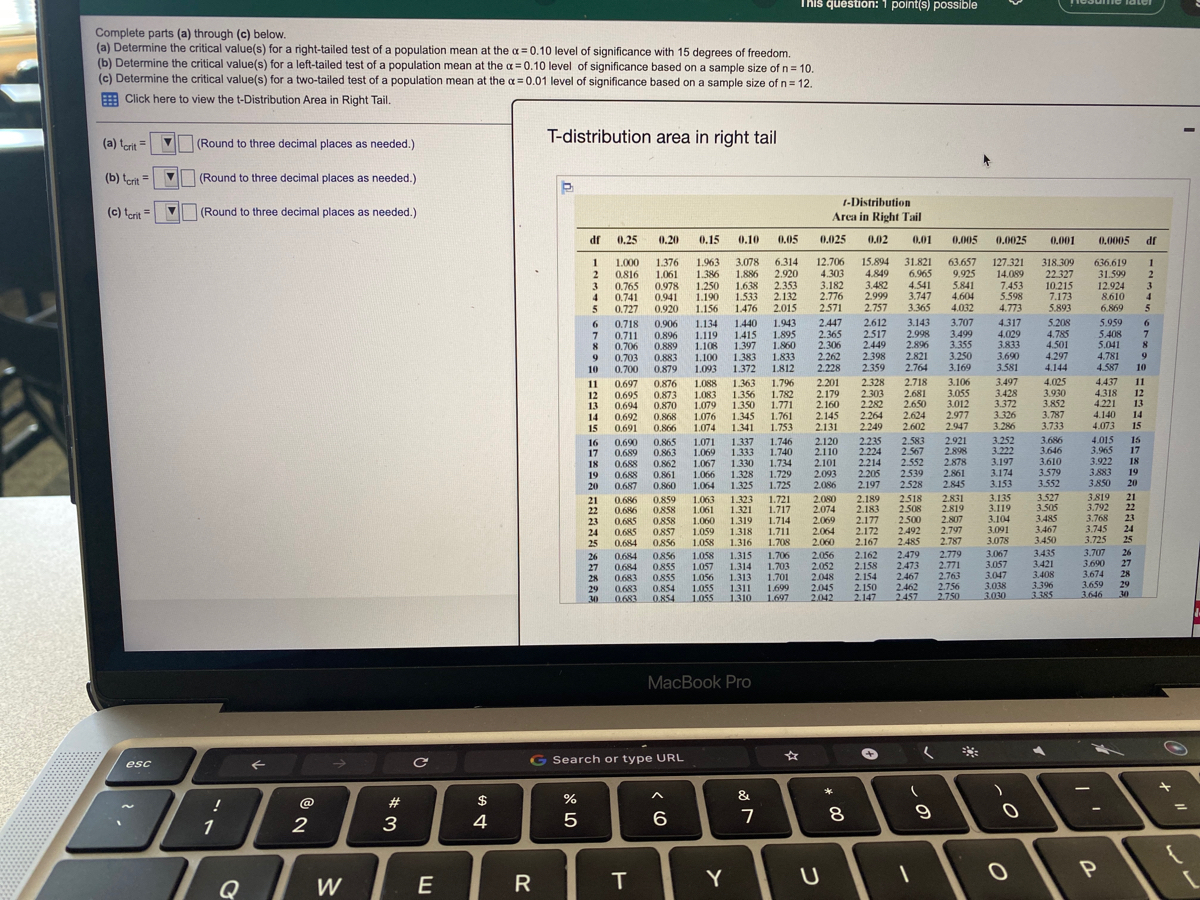
Complete parts (a) through (c) below.
(a) Determine the critical value(s) for a right-tailed test of a population mean at the a= 0.10 level of significance with 15 degrees of freedom.
(b) Determine the critical value(s) for a left-tailed test of a population mean at the a = 0.10 level of significance based on a sample size of n= 10.
(c) Determine the critical value(s) for a two-tailed test of a population mean at the a= 0.01 level of significance based on a sample size of n = 12.
E Click here to view the t-Distribution Area in Right Tail.
T-distribution area in right tail
(a) terit =
(Round to three decimal places as needed.)
(b) terit =
(Round to three decimal places as needed.)
1-Distribution
(c) terit =
(Round to three decimal places as needed.)
Area in Right Tail
df
0.25
0.20
0.15
0.10
0.05
0.025
0.02
0,01
0.005
0.0025
0,001
0.0005
df
318.309
22.327
10.215
7.173
5.893
1.376
15.894
1.963
1.386
1.250
1.190
1.156
3.078
1.886
1.638
1.533
1476
6.314
2.920
2.353
2.132
2.015
12.706
4.303
3.182
2.776
31.821
6.965
4.541
3.747
3.365
63.657
9.925
5.841
4.604
4.032
127.321
14.089
7.453
5.598
4.773
1
1.000
0.816
3
636.619
31.599
12.924
8.610
1
4.849
0.765
0.741
0.727
1.061
0.978
0.941
0.920
3.482
2.999
2.757
3
5
2571
6.869
0.718
0.711
0.706
0.703
0.700
1.943
1.895
1.860
1.833
1.812
2.447
2.365
2.306
2.262
2.228
2.612
2.517
2.449
2.398
2.359
3.143
2.998
2.896
2.821
2.764
3.707
3.499
3.355
3.250
3.169
4.317
4.029
3.833
3.690
3.581
5.208
4.785
4.501
4.297
5.959
5.408
5.041
4.781
4.587
0.906
1.134
1.119
1.108
1.100
1.093
6.
1.440
6.
1.415
1.397
1.383
1.372
0.896
0.889
8
0.883
0.879
10
4.144
10
2.328
2.303
2.282
2.264
2249
2.718
2.681
2.650
2.624
2.602
3.106
3.055
3.012
2.977
2.947
3.497
3.428
3.372
3.326
3.286
4.025
3.930
3.852
4.437
4.318
4.221
11
11
12
13
14
0.697
0.695
0.694
0.692
0.691
0.876
0.873
0.870
0.868
0.866
1.088 1.363
1.356
1.350
1.345
1.796
1.782
1.771
1.761
1.753
2.201
2.179
2.160
1.083
1.079
12
13
3.787
3.733
4.140
14
2.145
2.131
1.076
15
1.074
1.341
4.073
15
1.071 1.337
1.333
1.330
1.328
1.325
3.252
3.222
3.197
3.174
3.153
3.686
3.646
3.610
3.579
4.015
3.965
3.922
3.883
3850
15
0.865
0.863
0.862
0.861
0.860
1.746
1.740
1.734
1.729
1.725
2.235
2.224
2.214
2.205
2.197
2.583
2.567
2.552
2539
2.921
2.898
2.878
2.861
2.845
2.120
16
17
0,690
17
18
0.689
0.688
0.688
0.687
2.110
2.101
2.093
2.086
1.069
18
1.067
19
1.066
19
20
1.064
2.528
3.552
20
3.819
3.792
3.768
3.745
3.725
21
0.859
0858
0858
0.857
0856
2.831
2.819
3.135
3.119
3.104
3.091
3.078
3.067
3.527
3.505
3.485
3.467
3.450
1.721
1.717
2.080
2.074
2.069
2.064
2.060
2.189
2.183
2.177
2.172
2.167
2518
2.508
2.500
2.492
2.485
0.686
0.686
1.063
1.061
1.060
1.059
1.058
21
22
1.323
1.321
22
23
2.807
0.685
0.685
0.684
23
1.319
1.714
2.797
2.787
1.318
24
1.711
1.708
24
25
1.316
25
2.162
2.158
2.154
2.150
2.147
3435
3421
3.408
3.707
26
1.706
1.703
1.701
1.699
1.697
2.056
2.052
2.048
2.045
2.042
2.479
2.473
2.467
2.462
2457
2.779
2.771
2.763
2.756
2.750
0.684
0856
0855
0.855
0.854
0.854
1.058
1.057
1.056
1.055
1.055
26
1.315
27
28
27
0.684
1.314
3.057
3.690
1.313
1.311
1.310
3.047
3.038
3.030
3.674
3.659
3.646
28
0.683
29
30
0.683
0.683
3.396
3.385
29
30
MacBook Pro
G Search or type URL
esc
&
@
#
$
2
3
4
6
8
1
Y
Q
W
R
Expert Solution
This question has been solved!
Explore an expertly crafted, step-by-step solution for a thorough understanding of key concepts.

This is a popular solution

Trending nowThis is a popular solution!

Step by stepSolved in 2 steps with 2 images

Knowledge Booster

Similar questions
- (i) Determine if the hypothesis test is one tailed or two tailed. (ii) Find the critical value. Round the answer to at least two decimal places. (iii) Compute the test value. Round the standard deviations and F-score values to two decimal places as needed. (iv) Make the decision and summarize the results.arrow_forwardcomparison of the precisions of two machines developed for extracting juice from oranges is to be made using the following data. Is there sufficient evidence to indicate that there is a difference in the precision of the two machines at the 5% level of significance? Machine A Machine B s2 = 1.4 ounces2 s2 = 3.1 ounces2 n=25 n=20arrow_forwardIn a randomized block ANOVA, identify the statistic that is used as a measure of variationa. among the sample means for the treatments.b. among the sample means for the blocks.c. within the samples for the treatments with the variation due to blocks removed.arrow_forward
- Using an evenly distributed data population of 8,000 samples, how many Would fall between a Z-score of -0.5 and +0.5? (blank)arrow_forwardA traffic safety company publishes reports about motorcycle fatalities and helmet use. In the first accompanying data table, the distribution shows the proportion of fatalities by location of injury for motorcycle accidents. The second data table shows the location of injury and fatalities for 2073 riders not wearing a helmet. Complete parts (a) and (b) below. (a) Does the distribution of fatal injuries for riders not wearing a helmet follow the distribution for all riders? Use α = 0.10 level of significance. What are the null and alternative hypotheses? A. Ho: The distribution of fatal injuries for riders not wearing a helmet follows the same distribution for all other riders. H₁: The distribution of fatal injuries for riders not wearing a helmet does not follow the same distribution for all other riders. B. Ho: The distribution of fatal injuries for riders not wearing a helmet does not follow the same distribution for all other riders. H₁: The distribution of fatal injuries for…arrow_forwardTrue or false: The point estimate for the population mean of an xdistribution is computed from a random sample of the xdistribution.arrow_forward
- (a) Find the critical value(s) assuming that the population variances are equal. (b) Find the critical value(s) assuming that the population variances are not equal.arrow_forward(c) For a two-tailed test using the t-distribution, if the sample size is 10, find out the critical values based on the given significance levels: (1) a = 0.1, (2) a = 0.05, and (3) a = 0.01. %3Darrow_forwardIn a hypothesis test for the population variance, the alternate hypothesis is the population variance doesn't equal 17.0. The significance level to be used is 0.05 and the sample size to be taken is 25. The table value(s) to use from the chi-square distribution is/are 12.401 and 39.364. 13.181 39.364 40.671arrow_forward
- A researcher wants to measure average cardiovascular health of university students and compare those scores to the average scores in the general population. Assuming that population variance is known, what statistical test is most appropriate for this study? independent-samples t-test single-sample t-test z-test for sample mean related-samples t-testarrow_forwardAt a 0.05, test to see if the population variances from which the following samples were drawn are equal. The test statistic is Group 1 n₁ = 21 Group 2 n₂ = 19 $1 = 20 S2 = 18 (A) 1.56 (B) 1.23 (C) 1.26 (D) 1.11arrow_forward
arrow_back_ios
arrow_forward_ios
Recommended textbooks for you
- MATLAB: An Introduction with ApplicationsStatisticsISBN:9781119256830Author:Amos GilatPublisher:John Wiley & Sons Inc
 Probability and Statistics for Engineering and th...StatisticsISBN:9781305251809Author:Jay L. DevorePublisher:Cengage Learning
 Statistics for The Behavioral Sciences (MindTap C...StatisticsISBN:9781305504912Author:Frederick J Gravetter, Larry B. WallnauPublisher:Cengage Learning
  Elementary Statistics: Picturing the World (7th E...StatisticsISBN:9780134683416Author:Ron Larson, Betsy FarberPublisher:PEARSON
 The Basic Practice of StatisticsStatisticsISBN:9781319042578Author:David S. Moore, William I. Notz, Michael A. FlignerPublisher:W. H. Freeman
 Introduction to the Practice of StatisticsStatisticsISBN:9781319013387Author:David S. Moore, George P. McCabe, Bruce A. CraigPublisher:W. H. Freeman
MATLAB: An Introduction with Applications
Statistics
ISBN:9781119256830
Author:Amos Gilat
Publisher:John Wiley & Sons Inc
Probability and Statistics for Engineering and th...
Statistics
ISBN:9781305251809
Author:Jay L. Devore
Publisher:Cengage Learning
Statistics for The Behavioral Sciences (MindTap C...
Statistics
ISBN:9781305504912
Author:Frederick J Gravetter, Larry B. Wallnau
Publisher:Cengage Learning
Elementary Statistics: Picturing the World (7th E...
Statistics
ISBN:9780134683416
Author:Ron Larson, Betsy Farber
Publisher:PEARSON
The Basic Practice of Statistics
Statistics
ISBN:9781319042578
Author:David S. Moore, William I. Notz, Michael A. Fligner
Publisher:W. H. Freeman
Introduction to the Practice of Statistics
Statistics
ISBN:9781319013387
Author:David S. Moore, George P. McCabe, Bruce A. Craig
Publisher:W. H. Freeman