
MATLAB: An Introduction with Applications
6th Edition
ISBN: 9781119256830
Author: Amos Gilat
Publisher: John Wiley & Sons Inc
expand_more
expand_more
format_list_bulleted
Related questions
Question
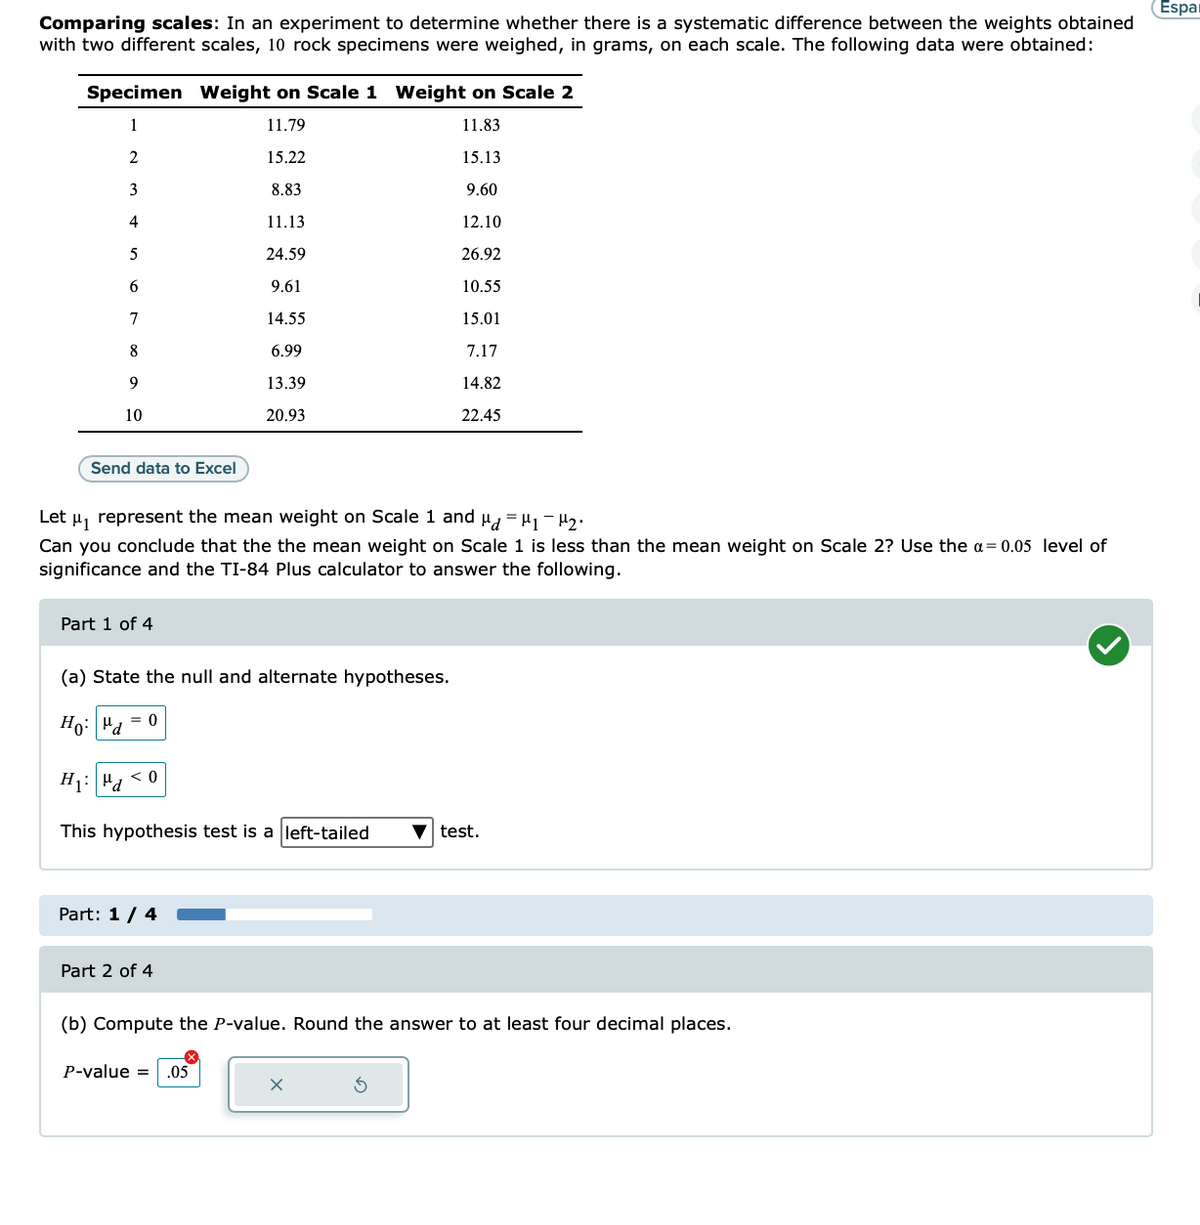

Transcribed Image Text:Comparing scales: In an experiment to determine whether there is a systematic difference between the weights obtained
with two different scales, 10 rock specimens were weighed, in grams, on each scale. The following data were obtained:
Specimen Weight on Scale 1 Weight on Scale 2
11.79
11.83
15.22
15.13
8.83
9.60
11.13
12.10
24.59
26.92
9.61
10.55
14.55
15.01
6.99
7.17
13.39
14.82
20.93
22.45
2
3
4
5
6
7
8
9
10
Send data to Excel
Let μ₁ represent the mean weight on Scale 1 and μd=₁₂.
Can you conclude that the the mean weight on Scale 1 is less than the mean weight on Scale 2? Use the a= 0.05 level of
significance and the TI-84 Plus calculator to answer the following.
Part 1 of 4
(a) State the null and alternate hypotheses.
Ho: "d
= 0
< 0
H₁: "d
This hypothesis test is a left-tailed
Part: 1 / 4
Part 2 of 4
(b) Compute the P-value. Round the answer to at least four decimal places.
P-value = .05
▼test.
X
Espar
Expert Solution
This question has been solved!
Explore an expertly crafted, step-by-step solution for a thorough understanding of key concepts.

This is a popular solution

Trending nowThis is a popular solution!

Step by stepSolved in 2 steps with 2 images

Knowledge Booster

Similar questions
- A researcher measures the relationship between hours worked by employed students and the number of units taken during the first semester of college for each individual in a group of 25 community college students. For this study: a. If we calculate the average hours worked by these community college students, the average would be an example of a ________ statistic b. Is a sample or population being measured here? c. What kind of a research study is this? d. N/n = e. What level of measurement is the number of units taken? Step 2 – check your work! Was your answer correct? If not, please make any correction here: Step 3 - if your answer was incorrect, please write out what was wrong (skip this if you were correct) show working for eacharrow_forwardA survey of the opinions of property owners about a street widening project was taken to determine whether the resulting opinion was related to the distance of front footage. A randomly selected sample of 100 property owners was contacted and the results are shown below. Opinion Front-Footage For Undecided Against Under 45 feet 12 4 4 45 – 120 feet 35 5 30 Over 120 feet 3 2 5 What is the computed value of chi-square? 5.4787 4.9985 9.2784 7.9842 11.0355arrow_forwardListed below are the measured radiation absorption rates (in W/kg) corresponding to 11 cell phones. Use the given data to construct a boxplot and identify the 5-number summary. 1.49 0.79 0.72 1.25 0.85 0.84 1.13 0.68 1.43 0.51 1.18 Question content area bottom Part 1 The 5-number summary is enter your response here, enter your response here, enter your response here, enter your response here, and enter your response here, all in W/kg. (Use ascending order. Type integers or decimals. Do not round.)arrow_forward
- In an experiment to determine whether there is a systematic difference between the weights obtained with two different scales, 10 rock specimens were weighed, in grams, on each scale. The following data were obtained: Specimen Weight on Scale 1 Weight on Scale 2 1 13.36 13.19 2 16.80 16.43 3 9.75 9.52 4 11.03 11.47 5 26.00 26.22 6 10.80 10.73 7 14.68 14.74 8 6.60 6.72 9 13.02 12.95 10 22.29 22.64 Let μ1 represent the mean weight on Scale 1 and =μd−μ1μ2.Can you conclude that the the mean weight on Scale 1is less than the mean weight on Scale 2? Use the = α0.05 level of significance. (a) State the null and alternate hypotheses. (b) Compute the test statistic. (c) State a conclusion.arrow_forwardWhich of the following statistics are unbiased estimators of the population parameter? Select all that apply. A) Sample mean B) Sample proportion C) Sample rangearrow_forwardHelp me find P valuearrow_forward
- Determine the point of estimate of the population mean and margin of error from the given information: Lower Bound: 5 Upper Bound: 23 Question 4 options: x¯= 15 E = 10 x¯= 12 E = 9 x¯= 13.5 E = 9 x¯= 14 E = 9arrow_forwardGiven the following data, determine the Chi-Square obtained statistic: a b c d 9 6 10 8 4 1 4 7arrow_forward
arrow_back_ios
arrow_forward_ios
Recommended textbooks for you
- MATLAB: An Introduction with ApplicationsStatisticsISBN:9781119256830Author:Amos GilatPublisher:John Wiley & Sons Inc
 Probability and Statistics for Engineering and th...StatisticsISBN:9781305251809Author:Jay L. DevorePublisher:Cengage Learning
 Statistics for The Behavioral Sciences (MindTap C...StatisticsISBN:9781305504912Author:Frederick J Gravetter, Larry B. WallnauPublisher:Cengage Learning
  Elementary Statistics: Picturing the World (7th E...StatisticsISBN:9780134683416Author:Ron Larson, Betsy FarberPublisher:PEARSON
 The Basic Practice of StatisticsStatisticsISBN:9781319042578Author:David S. Moore, William I. Notz, Michael A. FlignerPublisher:W. H. Freeman
 Introduction to the Practice of StatisticsStatisticsISBN:9781319013387Author:David S. Moore, George P. McCabe, Bruce A. CraigPublisher:W. H. Freeman
MATLAB: An Introduction with Applications
Statistics
ISBN:9781119256830
Author:Amos Gilat
Publisher:John Wiley & Sons Inc
Probability and Statistics for Engineering and th...
Statistics
ISBN:9781305251809
Author:Jay L. Devore
Publisher:Cengage Learning
Statistics for The Behavioral Sciences (MindTap C...
Statistics
ISBN:9781305504912
Author:Frederick J Gravetter, Larry B. Wallnau
Publisher:Cengage Learning
Elementary Statistics: Picturing the World (7th E...
Statistics
ISBN:9780134683416
Author:Ron Larson, Betsy Farber
Publisher:PEARSON
The Basic Practice of Statistics
Statistics
ISBN:9781319042578
Author:David S. Moore, William I. Notz, Michael A. Fligner
Publisher:W. H. Freeman
Introduction to the Practice of Statistics
Statistics
ISBN:9781319013387
Author:David S. Moore, George P. McCabe, Bruce A. Craig
Publisher:W. H. Freeman