
MATLAB: An Introduction with Applications
6th Edition
ISBN: 9781119256830
Author: Amos Gilat
Publisher: John Wiley & Sons Inc
expand_more
expand_more
format_list_bulleted
Related questions
Question
Compare the appropriate measures of center and variability for the two sets of data.
Data Set A has a higher
Data Set A has a higher
Data Set A has a lower mean value of 8.8, and Data Set B has a higher range value of 8.
Data Set A has a lower median value of 9, and Data Set B has a higher IQR value of 8.
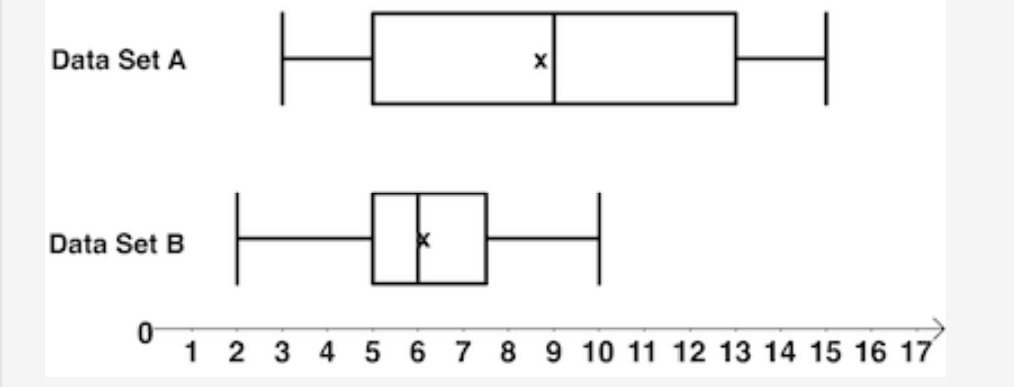

Transcribed Image Text:Data Set A
山
1 2 3 4 5 6 7 8 9 10 11 12 13 14 15 16 17
Data Set B
-
Expert Solution
This question has been solved!
Explore an expertly crafted, step-by-step solution for a thorough understanding of key concepts.

This is a popular solution

Trending nowThis is a popular solution!

Step by stepSolved in 5 steps with 42 images

Knowledge Booster

Similar questions
- Given the following frequency table of values, is the mean or the median likely to be a better measure of the center of the data set? Value Frequency 21 2 42 3 43 8 46 7 49 3 51 1arrow_forwardConsider the following set of data. 87, 83, 71, 66, 45, 79, 63, 74, 59, 99, 68, 93 Find the mean, the median, the mode, and the midrange.arrow_forward6. Find the mean, median, and mode for each set of data. a. 80 90 100 110 110 140 b. 10 90 100 110 110 210 c. How do your answers for parts (a) and (b) differ (or agree)? Why?arrow_forward
- Here is a FDT for a small data set: data freq 21 2 22 2 23 3 24 3 25 10 Find the following measures of central tendency.mean = median = mode =arrow_forwardThe length of time it takes for a worker to perform certain task (in minutes) was recorded for 10 workers. The resulting data values were the following: 5, 3, 11, 7, 6, 9, 4, 8, 7, 10 Find the mean, median, mode, range, variance and standard deviation. In the answers for the mean, variance, and standard deviation leave one digit after decimal point. a. Mean = d. Range = b. Median = e. Variance = c. Mode = f. Standard deviation =arrow_forwardThe following refer to the following data set: 52.2 20.1 38.2 16.4 52.2 44.7 35.6 26.9 52.2 31.2 What is the arithmetic mean of this data set? mean = What is the median of this data set? median = What is the mode of this data set? mode =arrow_forward
- You may need to use the appropriate appendix table or technology to answer this question. According to the Vivino website, suppose the mean price for a bottle of red wine that scores 4.0 or higher on the Vivino Rating System is $32.48. A New England-based lifestyle magazine wants to determine if red wines of the same quality are less expensive in Providence, and it has collected prices for 65 randomly selected red wines of similar quality from wine stores throughout Providence. The mean and standard deviation for this sample are $30.15 and $12, respectively. (a) Develop appropriate hypotheses for a test to determine whether the sample data support the conclusion that the mean price in Providence for a bottle of red wine that scores 4.0 or higher on the Vivino Rating System is less than the population mean of $32.48. (Enter != for ≠ as needed.) H0: Ha: (b) Using the sample from the 65 bottles, what is the test statistic? (Round your answer to three decimal places.)…arrow_forwardFind a set of 5 items in a data set that have a range of 9, a mean of 1, a median of 12, and a mode of 15arrow_forward
arrow_back_ios
arrow_forward_ios
Recommended textbooks for you
- MATLAB: An Introduction with ApplicationsStatisticsISBN:9781119256830Author:Amos GilatPublisher:John Wiley & Sons Inc
 Probability and Statistics for Engineering and th...StatisticsISBN:9781305251809Author:Jay L. DevorePublisher:Cengage Learning
 Statistics for The Behavioral Sciences (MindTap C...StatisticsISBN:9781305504912Author:Frederick J Gravetter, Larry B. WallnauPublisher:Cengage Learning
  Elementary Statistics: Picturing the World (7th E...StatisticsISBN:9780134683416Author:Ron Larson, Betsy FarberPublisher:PEARSON
 The Basic Practice of StatisticsStatisticsISBN:9781319042578Author:David S. Moore, William I. Notz, Michael A. FlignerPublisher:W. H. Freeman
 Introduction to the Practice of StatisticsStatisticsISBN:9781319013387Author:David S. Moore, George P. McCabe, Bruce A. CraigPublisher:W. H. Freeman
MATLAB: An Introduction with Applications
Statistics
ISBN:9781119256830
Author:Amos Gilat
Publisher:John Wiley & Sons Inc
Probability and Statistics for Engineering and th...
Statistics
ISBN:9781305251809
Author:Jay L. Devore
Publisher:Cengage Learning
Statistics for The Behavioral Sciences (MindTap C...
Statistics
ISBN:9781305504912
Author:Frederick J Gravetter, Larry B. Wallnau
Publisher:Cengage Learning
Elementary Statistics: Picturing the World (7th E...
Statistics
ISBN:9780134683416
Author:Ron Larson, Betsy Farber
Publisher:PEARSON
The Basic Practice of Statistics
Statistics
ISBN:9781319042578
Author:David S. Moore, William I. Notz, Michael A. Fligner
Publisher:W. H. Freeman
Introduction to the Practice of Statistics
Statistics
ISBN:9781319013387
Author:David S. Moore, George P. McCabe, Bruce A. Craig
Publisher:W. H. Freeman