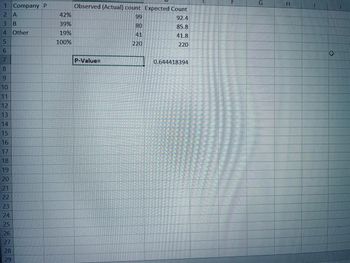
Company A has recently conducted aggressive advertising campaigns to maintain and possible increase its share of the market for fabric softener.
Its main competitor, company B, has 39%of the market, and a few other competitors account for the remaining 19%.
To determine whether the market shares changed after the advertising campaign, the marketing manager for company A solicited the preferences of a random sample 220 customers of fabric softener.
Of the 220 customers, 99 indicated a preference for company A's product, 80 preferred company B's product, and the remaining 41 preferred the products of one of the other competitors.
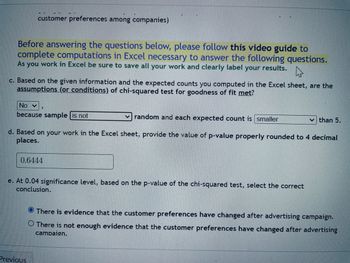
Can the analyst infer at 4% significance level that customer preferences have changed from their levels before the advertising campaigns were launched?


Step by stepSolved in 3 steps with 7 images

- The statistics department at a large Midwestern university is interested in how students feel about their introductory statistics course. They decide to randomly select 60 introductory stats students to give a survey, 10 from both the freshman and sophomore class ranks and 20 from both the junior and senior class ranks. They discover that of the 60 total respondents, 73% have a positive attitude toward intro stats. The proportion of the 60 introductory statistics students surveyed by the statistics department that did have positive attitudes toward intro stats (73%) is called a O a. population parameter O b. residual O c. correlation coefficient O d. sample statistic 3 Stat100 Practice..pdf 7 Writing Prompt 3.docx E Online Syllabus J...pdf E Bios357Schedul.pdf SH OCT1 étv 20 F3 トI A FI F9 F10 F5 F7 F8 F2 F4 %23 2$ & * 2 4. 5 6 7 8 9 Q W E T Y S F G H K しのarrow_forwardThe International Business Society conducts a series of managerial surveys to detect challenges that international managers encounter and what strategies help them overcome those challenges. A previous study showed that employee retention is the most critical organizational challenge currently confronted by international managers. One strategy that may impact employee retention is a successful employee recognition program. The International Business Society randomly selected 423 small firms and 192 large firms. The study showed that 326 of the 423 small firms have employee retention programs compared to 167 of the 192 large organizations. At the 0.01 level of significance, is there evidence of a significant difference between small firms and large firms concerning the proportion that has employee recognition program? Find the p-value and interpret its meaning? Construct and interpret a 99% confidence interval estimate for the difference between small firms and large firms concerning…arrow_forwardThe traffic pattern is being analyzed for traffic going into Myrtle Beach on 501. The intersection of US-501 and US-17 Bypass was designed such that 50% of the traffic would continue straight on 501, 30% would go north on 17 Bypass, and 20% would go south on 17 Bypass. Since then, there has been a significant amount of commercial growth around the intersection that may have impacted the traffic flow. A sample of 600 cars is to be reviewed to see if the traffic has significantly changed using the chi-square test. How many cars do you expect to go straight on US-501?arrow_forward
- According to a Gallup poll in October 2015, having young children at home greatly influences whether women in the U.S. prefer to stay at home or work outside of it. More than half of women, 56%, who have a child younger than 18 would ideally like to stay home and care for their house and family, while 58% of those without young children would rather work outside the home. Having young children makes little difference in men's preferences, with close to three-quarters preferring to work regardless of their parenting status. Gallup states that their method has a margin of error of 0.031.(a) Give a point estimate for the proportion of all US women with a child under 18 that would like to stay at home.(b) Give an interval estimate for the proportion of all US women with a child under 18 that would like to stay at home. Use three decimal places in your answer.( , )(c) What is the difference between a point estimate and an interval estimate?arrow_forwardIn 2018, a consumer goods giant had more than 20 brands with more than $1 billion in annual sales. How does the company create so many successful consumer products? They effectively invests in research and development to understand what consumers want. One method used to determine consumer preferences is called conjoint analysis. Conjoint analysis allows a company to ascertain the utility that a respondent in the conjoint study places on a design of a given product. The higher the utility, the more valuable a respondent finds the design. Suppose we have conducted a conjoint study and have the following estimated utilities (higher is preferred) for each of three different designs for a new whitening toothpaste. Respondent Utilities Design A Design B Design C 1 24.6 34.4 28.8 2 31.4 31.4 33.9 3 31.8 20.2 27.8 4 15.4 26.4 25.1 5 20.7 18.3 18.2 6 41.0 34.0 44.8 7 27.1 22.5 27.3 8 20.2 21.8 27.9 9 31.6 29.4 31.3 10 24.4 29.0 29.3 At the 0.05 level of…arrow_forwardIn a US presidential election, the incumbent president wins with 51.5% of the vote to 48.2% for the primary challenger (and .3% to others). In a nationwide telephone poll of 1000 people conducted exactly one week before the election by a university polling group, 49% of people polled supported the incumbent president, 50% supported the challenger, and 1% supported other candidates. a. For the polling study, what was the population of interest? b. What was the sample? c. Why did the sample results differ from the population? d. What are two constants that might have limited the generalizability of the polling results?arrow_forward
- A telephone service representative believes that the proportion of customers completely satisfied with their local telephone service is different between the South and the Midwest. The representative's belief is based on the results of a survey. The survey included a random sample of 11601160 southern residents and 12601260 midwestern residents. 43%43% of the southern residents and 56%56% of the midwestern residents reported that they were completely satisfied with their local telephone service. Find the 80%80% confidence interval for the difference in two proportions. Step 3 of 3 : Construct the 80%80% confidence interval. Round your answers to three decimal places.arrow_forwardA researcher conducted a study to determine whether a new type of phys- ical therapy would help people recovering from knee injuries. The study included 10 patients, and 5 physical therapists. The researcher decided to conduct the experiment using a matched pairs design, as follows: Two patients were (randomly) assigned to each physical therapist. Then, one of the two patients was randomly chosen to receive the new treatment, while the other received the old treatment. After one week, the researcher measured each patient’s improvement in range of motion (ROM), in degrees (◦). (a) Describe the benefit of conducting a matched pairs experiment in this way. (b) The table/image attached to this question shows the data obtained from this experiment: By hand, carry out a t-test to see if the mean difference in ROM improvements between the two treatments (New minus Old) is greater than zero.arrow_forwardAn ad agency is developing a campaign to promote a business opening in new mall development. To develop an appropriate mailing list, they decide to purchase lists of credit card holders from MasterCard and American Express. Combining the lists, they find the following: 40 percent of the people on the list have only a MasterCard and 10 percent have only an American Express card. Another 20 percent hold both MasterCard and American Express. Finally, 30 percent of those on the list have neither card. The contingency table is as the following: MasterCard No MasterCard .10 American Express 20 No American Express.40 What is the probability that a person on the list does not have a Mastercard? Select one: O a. .90 O b. 40 O C. .18 d. .33 e. .70arrow_forward
- A doctor wanted to study the effect of four different treatments on mental health. A group of 100 adults experiencing depression volunteered for the study. The doctor randomly assigned one-fourth of them to each of four groups. Group 1 followed a specific exercise plan, group 2 followed a specific diet plan, group 3 followed an exercise and diet plan, and group 4 did not follow any plan. After 4 weeks, the doctor contacted each participant and asked them if they felt any better. The results are displayed in the table. The doctor would like to know if these data provide convincing evidence that the distribution of responses differs across the treatment groups in the population of all patients like these. The random condition is met. The 10% condition is not needed because random sampling did not take place. This table of expected counts shows that all expected counts are at least 5. What is the value of the chi-square test statistic? χ‑2 = 5.03 χ‑2 = 6.26 χ‑2 = 25.33 χ‑2 = 39.22arrow_forwardEmployees in the marketing department of a large regional restaurant chain are researching the amount of money that households in the region spend in restaurants per year. The employees are looking at how the amount spent annually in restaurants by households led by people ages 25 to 34 compares to households led by people ages 45 to 54. To conduct the research, the employees randomly select 100 households in the region led by people ages 25 to 34 and 100 households in the region led by people ages 45 to 54. Each household is asked how much was spent in restaurants during the previous 12 months. The amounts spent for each household, in dollars, are provided in the samples below. One household in each group spent $1,924 in restaurants during the previous 12 months. Use Excel to calculate the z-score for the data value that represents the household that spent $1,924 in restaurants for each group. Round your answers to two decimal places. Provide your answer below: 25 to 34 45 to 54…arrow_forward
 MATLAB: An Introduction with ApplicationsStatisticsISBN:9781119256830Author:Amos GilatPublisher:John Wiley & Sons Inc
 Probability and Statistics for Engineering and th...StatisticsISBN:9781305251809Author:Jay L. DevorePublisher:Cengage Learning
 Statistics for The Behavioral Sciences (MindTap C...StatisticsISBN:9781305504912Author:Frederick J Gravetter, Larry B. WallnauPublisher:Cengage Learning
 Elementary Statistics: Picturing the World (7th E...StatisticsISBN:9780134683416Author:Ron Larson, Betsy FarberPublisher:PEARSON
 The Basic Practice of StatisticsStatisticsISBN:9781319042578Author:David S. Moore, William I. Notz, Michael A. FlignerPublisher:W. H. Freeman
 Introduction to the Practice of StatisticsStatisticsISBN:9781319013387Author:David S. Moore, George P. McCabe, Bruce A. CraigPublisher:W. H. Freeman


