
MATLAB: An Introduction with Applications
6th Edition
ISBN: 9781119256830
Author: Amos Gilat
Publisher: John Wiley & Sons Inc
expand_more
expand_more
format_list_bulleted
Related questions
Question
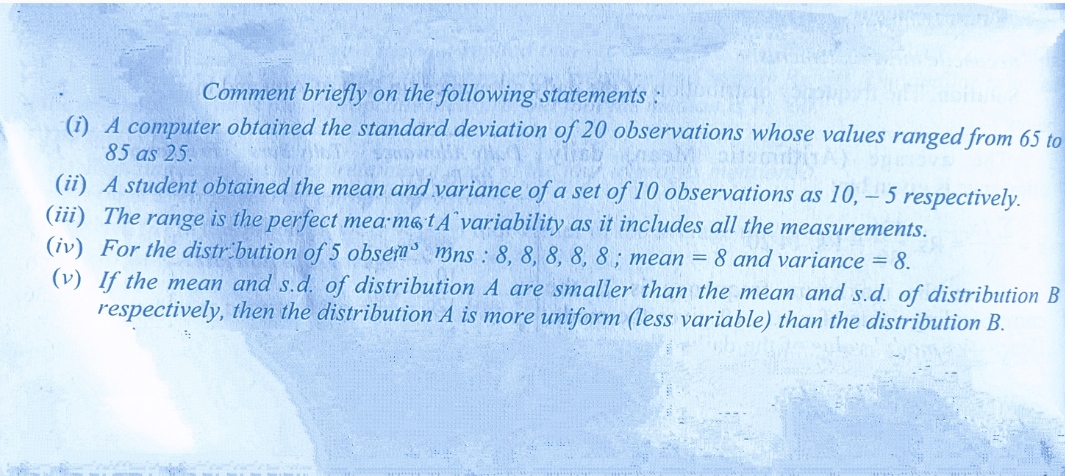

Transcribed Image Text:Comment briefly on the following statements :
(i) A computer obtained the standard deviation of 20 observations whose values ranged from 65 to
85 as 25.
(ii) A student obtained the mean and variance of a set of 10 observations as 10, – 5 respectively.
(iii) The range is the perfect mea m&tA¨variability as it includes all the measurements.
(iv) For the distr.bution of 5 obsem mns : 8, 8, 8, 8, 8; mean = 8 and variance = 8.
(v) If the mean and s.d. of distribution A are smaller than the mean and s.d. of distribution B
respectively, then the distribution A is more uniform (less variable) than the distribution B.
Expert Solution
This question has been solved!
Explore an expertly crafted, step-by-step solution for a thorough understanding of key concepts.

Step by stepSolved in 4 steps

Knowledge Booster

Similar questions
- number 10arrow_forwardFor a data set of the pulse rates for a sample of adult females, the lowest pulse rate is 37 beats perminute, the mean of the listed pulse rates is x=77.0 beats per minute, and their standard deviation is s=24.8 beats per minute. a. What is the difference between the pulse rate of 37 beats per minute and the mean pulse rate of the females? b. How many standard deviations is that [the difference found in part (a)]? c. Convert the pulse rate of 37 beats per minutes to a z score. d. If we consider pulse rates that convert to z scores between −2 and 2 to be neither significantly low nor significantly high, is the pulse rate of 37 beats per minute significant?arrow_forwardFor a data set of the pulse rates for a sample of adult females, the lowest pulse rate is 34 beats per minute, the mean of the listed pulse rates is x=72.0 beats per minute, and their standard deviation is s=13.8 beats per minute. a. What is the difference between the pulse rate of 34 beats per minute and the mean pulse rate of the females? b. How many standard deviations is that [the difference found in part (a)]? c. Convert the pulse rate of 34 beats per minutes to a z score. d. If we consider pulse rates that convert to z scores between −2 and 2 to be neither significantly low nor significantly high, is the pulse rate of 34 beats per minute significant?arrow_forward
- Use z scores to compare the given values. The tallest living man at one time had a height of 238 cm. The shortest living man at that time had a height of 142.4 cm. Heights of men at that time had a mean of 175.45 cm and a standard deviation of 5.59 cm. Which of these two men had the height that was more extreme? ... Since the z score for the tallest man is z = 0 and the z score for the shortest man is z = the man had the height that was Im- more extreme. (Round to two decimal places.) shortest tallestarrow_forwardFor a data set of the pulse rates for a sample of adult females, the lowest pulse rate is 38 beats per minute, the mean of the listed pulse rates is x=79.0 beats per minute, and their standard deviation is s=22.1 beats per minute. a. What is the difference between the pulse rate of 38 beats per minute and the mean pulse rate of the females? b. How many standard deviations is that [the difference found in part (a)]? c. Convert the pulse rate of 38 beats per minutes to a z score. d. If we consider pulse rates that convert to z scores between −2 and 2 to be neither significantly low nor significantly high, is the pulse rate of 38 beats per minute significant?arrow_forward7.arrow_forward
- A rugby team from the country of Atlantis is formed by randomly drawing from its population. The population distribution is normally distributed with a mean of 165 cm and a standard deviation of 10 cm. The team draws 26 people for the team. Given a population mean of 165cm, how many standard deviations would a sample mean of 163cm be from the true value? Give your answer rounded to two decimal places.arrow_forwardThe results from a statistics class’ first test are as follows: The average grade obtained on the test by its 45 students is an 85, with a standard deviation of 15 points. Answer the following based on this information: a. Approximately how many people received a failing grade (less than 65) b. What percentage of people received a grade between a 70 and a 91? c. What percentage of individuals received a score whose z-score was -.70 or less? d. What grade is required in order to be in the top 15 percent? The top 10 percent? e. What percentage of people received a grade between 85 and 95? f. What percentage of people received a grade of 94 or less? g. What grade is required to be in the bottom 20%? h. What z-score is required to be in the top 40%? i. What percentage of individuals have a z-score between -1 and 1.40? j. What percentage of individuals have a z-score between 1.05 and 1.40?arrow_forward
arrow_back_ios
arrow_forward_ios
Recommended textbooks for you
- MATLAB: An Introduction with ApplicationsStatisticsISBN:9781119256830Author:Amos GilatPublisher:John Wiley & Sons Inc
 Probability and Statistics for Engineering and th...StatisticsISBN:9781305251809Author:Jay L. DevorePublisher:Cengage Learning
 Statistics for The Behavioral Sciences (MindTap C...StatisticsISBN:9781305504912Author:Frederick J Gravetter, Larry B. WallnauPublisher:Cengage Learning
  Elementary Statistics: Picturing the World (7th E...StatisticsISBN:9780134683416Author:Ron Larson, Betsy FarberPublisher:PEARSON
 The Basic Practice of StatisticsStatisticsISBN:9781319042578Author:David S. Moore, William I. Notz, Michael A. FlignerPublisher:W. H. Freeman
 Introduction to the Practice of StatisticsStatisticsISBN:9781319013387Author:David S. Moore, George P. McCabe, Bruce A. CraigPublisher:W. H. Freeman
MATLAB: An Introduction with Applications
Statistics
ISBN:9781119256830
Author:Amos Gilat
Publisher:John Wiley & Sons Inc
Probability and Statistics for Engineering and th...
Statistics
ISBN:9781305251809
Author:Jay L. Devore
Publisher:Cengage Learning
Statistics for The Behavioral Sciences (MindTap C...
Statistics
ISBN:9781305504912
Author:Frederick J Gravetter, Larry B. Wallnau
Publisher:Cengage Learning
Elementary Statistics: Picturing the World (7th E...
Statistics
ISBN:9780134683416
Author:Ron Larson, Betsy Farber
Publisher:PEARSON
The Basic Practice of Statistics
Statistics
ISBN:9781319042578
Author:David S. Moore, William I. Notz, Michael A. Fligner
Publisher:W. H. Freeman
Introduction to the Practice of Statistics
Statistics
ISBN:9781319013387
Author:David S. Moore, George P. McCabe, Bruce A. Craig
Publisher:W. H. Freeman