
MATLAB: An Introduction with Applications
6th Edition
ISBN: 9781119256830
Author: Amos Gilat
Publisher: John Wiley & Sons Inc
expand_more
expand_more
format_list_bulleted
Related questions
Concept explainers
Question
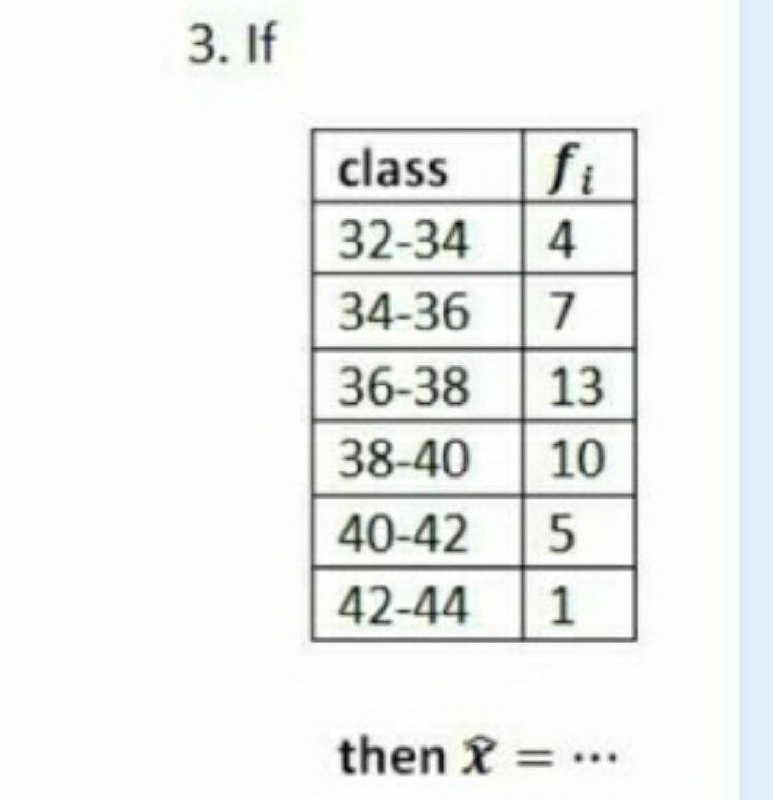

Transcribed Image Text:3. If
class
fi
32-34
4
34-36
36-38
13
38-40
10
40-42
42-44
then X =
Expert Solution
This question has been solved!
Explore an expertly crafted, step-by-step solution for a thorough understanding of key concepts.

Step by stepSolved in 2 steps

Knowledge Booster


Learn more about
Need a deep-dive on the concept behind this application? Look no further. Learn more about this topic, statistics and related others by exploring similar questions and additional content below.Similar questions
- #4arrow_forward5. If the median annual salary for 4 employees is $60,000, then which of the following must be true? O A 2 people earn $60,000 a year or less, and 2 people earn $60,000 a year or more OB. 2 people earn less than $60,000 a year, and 2 people earn more than $60,000 a year. OC. At least one person earns exactly $60,000 a year. OD. The mean and mode are also $60,000.arrow_forwardB Salaries for 39 Engineers Employed by the Solnar Company B 9 0 1 12 83 34 35 36 37 Salary ($1000) 48 50 52 54 56 59 59 59 59 60 65 65 67 70 78 86 88 89 90 95 95 96 97 100 102 110 115 118 120 124 125 125 128 130 130 38 39 40 41 42 43 44 130 131 134 134 Years 1 1 1 1 2 5 2 2 4 7 3 4344 10 10 7 14 10 15 15 10 14 13 13 25 34 30 25 19 18 32 19 20 18 20 32 35 YearsSq 1 1 1 1 4 25 4 4 16 49 9 16 9 16 16 100 100 49 196 100 225 225 100 196 169 169 625 1156 900 625 361 324 1024 361 400 324 400 1024 1225 Male 0 0 1 1 0 0 1 1 1 0 0 0 1 1 0 1 1 0 1 0 1 1 1 1 1 1 1 1 1 1 1 1 1 1 1 1 1 Years x Male 0 0 1 1 0 0 2 2 4 0 0 0 3 4 4 0 10 7 0 10 0 15 10 14 13 13 25 34 30 25 19 18 32 19 20 18 20 32 35 Leaming Copyright 2019 by The McGraw-Hill Companies This spreadsheet is intended solely for educational purposes by licensed users of Connect Note: The binary variable Male is 1 if the engineer is male, 0 otherwisearrow_forward
- Number of ChildrenTable 1 shows the number of women (per 1000) between 15 and 50 years of age who have been married grouped by the number of children they have had. Table 2 gives the same information for women who have never been married.1 Number of Children Women per 1000 0 162 1 213 2 344 3 182 4 69 5+ 32 Table 1 Women who have been married Number of Children Women per 1000 0 752 1 117 2 72 3 35 4 15 5+ 10 Table 2 Women who have never been married 1http://www.census.gov/hhes/fertility/data/cps/2014.html, Table 1, June 2014. Condition gt requires numbers instead of "null" and "0" (a) Without doing any calculations, which of the two samples appears to have the highest mean number of children? Women who have been marriedWomen who have never been married Which of the distributions appears to have the mean most different from the median? Women who have been marriedWomen who have never been married…arrow_forwardIf A = [1 0 0 -5 -31 1 0 -9 then 1arrow_forward
arrow_back_ios
arrow_forward_ios
Recommended textbooks for you
- MATLAB: An Introduction with ApplicationsStatisticsISBN:9781119256830Author:Amos GilatPublisher:John Wiley & Sons Inc
 Probability and Statistics for Engineering and th...StatisticsISBN:9781305251809Author:Jay L. DevorePublisher:Cengage Learning
 Statistics for The Behavioral Sciences (MindTap C...StatisticsISBN:9781305504912Author:Frederick J Gravetter, Larry B. WallnauPublisher:Cengage Learning
  Elementary Statistics: Picturing the World (7th E...StatisticsISBN:9780134683416Author:Ron Larson, Betsy FarberPublisher:PEARSON
 The Basic Practice of StatisticsStatisticsISBN:9781319042578Author:David S. Moore, William I. Notz, Michael A. FlignerPublisher:W. H. Freeman
 Introduction to the Practice of StatisticsStatisticsISBN:9781319013387Author:David S. Moore, George P. McCabe, Bruce A. CraigPublisher:W. H. Freeman
MATLAB: An Introduction with Applications
Statistics
ISBN:9781119256830
Author:Amos Gilat
Publisher:John Wiley & Sons Inc
Probability and Statistics for Engineering and th...
Statistics
ISBN:9781305251809
Author:Jay L. Devore
Publisher:Cengage Learning
Statistics for The Behavioral Sciences (MindTap C...
Statistics
ISBN:9781305504912
Author:Frederick J Gravetter, Larry B. Wallnau
Publisher:Cengage Learning
Elementary Statistics: Picturing the World (7th E...
Statistics
ISBN:9780134683416
Author:Ron Larson, Betsy Farber
Publisher:PEARSON
The Basic Practice of Statistics
Statistics
ISBN:9781319042578
Author:David S. Moore, William I. Notz, Michael A. Fligner
Publisher:W. H. Freeman
Introduction to the Practice of Statistics
Statistics
ISBN:9781319013387
Author:David S. Moore, George P. McCabe, Bruce A. Craig
Publisher:W. H. Freeman