
MATLAB: An Introduction with Applications
6th Edition
ISBN: 9781119256830
Author: Amos Gilat
Publisher: John Wiley & Sons Inc
expand_more
expand_more
format_list_bulleted
Related questions
Concept explainers
Topic Video
Question
10 see pictures
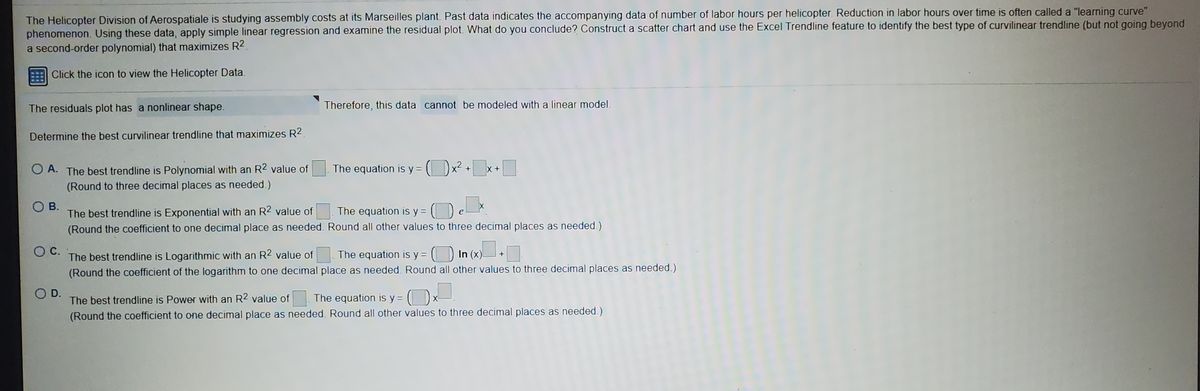

Transcribed Image Text:The Helicopter Division of Aerospatiale is studying assembly costs at its Marseilles plant. Past data indicates the accompanying data of number of labor hours per helicopter. Reduction in labor hours over time is often called a "learning curve"
phenomenon. Using these data, apply simple linear regression and examine the residual plot. What do you conclude? Construct a scatter chart and use the Excel Trendline feature to identify the best type of curvilinear trendline (but not going beyond
a second-order polynomial) that maximizes R2.
Click the icon to view the Helicopter Data.
The residuals plot has a nonlinear shape.
Therefore, this data cannot be modeled with a linear model.
Determine the best curvilinear trendline that maximizes R2.
The equation is y = ()x² +
O A. The best trendline is Polynomial with an R2 value of
(Round to three decimal places as needed.)
O B.
The best trendline is Exponential with an R2 value of
The equation is y =
(Round the coefficient to one decimal place as needed. Round all other values to three decimal places as needed.)
OC.
The best trendline is Logarithmic with an R2 value of
The equation is y =
In (x)
(Round the coefficient of the logarithm to one decimal place as needed. Round all other values to three decimal places as needed.)
O D.
The best trendline is Power with an R2 value of
The equation is y = ( )x
(Round the coefficient to one decimal place as needed. Round all other values to three decimal places as needed.)

Transcribed Image Text:Helicopter Number
Labor Hours
1
2000
2.
1450
3.
1240
4
1144
1074
6.
1025
981
8.
959
Expert Solution
This question has been solved!
Explore an expertly crafted, step-by-step solution for a thorough understanding of key concepts.

Step by stepSolved in 6 steps with 20 images

Knowledge Booster


Learn more about
Need a deep-dive on the concept behind this application? Look no further. Learn more about this topic, statistics and related others by exploring similar questions and additional content below.Similar questions
- Please box answer and write it in the same format as the question. Do not type it out only hand written. Chapter 2.4 Question 1arrow_forwardPlease box answer and write it in the same format as the question. Do not type it out only hand written. Chapter 2.4, Question 3arrow_forwardDescribe how the number of dots increases from Stage 1 to Stage 3.arrow_forward
arrow_back_ios
arrow_forward_ios
Recommended textbooks for you
- MATLAB: An Introduction with ApplicationsStatisticsISBN:9781119256830Author:Amos GilatPublisher:John Wiley & Sons Inc
 Probability and Statistics for Engineering and th...StatisticsISBN:9781305251809Author:Jay L. DevorePublisher:Cengage Learning
 Statistics for The Behavioral Sciences (MindTap C...StatisticsISBN:9781305504912Author:Frederick J Gravetter, Larry B. WallnauPublisher:Cengage Learning
  Elementary Statistics: Picturing the World (7th E...StatisticsISBN:9780134683416Author:Ron Larson, Betsy FarberPublisher:PEARSON
 The Basic Practice of StatisticsStatisticsISBN:9781319042578Author:David S. Moore, William I. Notz, Michael A. FlignerPublisher:W. H. Freeman
 Introduction to the Practice of StatisticsStatisticsISBN:9781319013387Author:David S. Moore, George P. McCabe, Bruce A. CraigPublisher:W. H. Freeman
MATLAB: An Introduction with Applications
Statistics
ISBN:9781119256830
Author:Amos Gilat
Publisher:John Wiley & Sons Inc
Probability and Statistics for Engineering and th...
Statistics
ISBN:9781305251809
Author:Jay L. Devore
Publisher:Cengage Learning
Statistics for The Behavioral Sciences (MindTap C...
Statistics
ISBN:9781305504912
Author:Frederick J Gravetter, Larry B. Wallnau
Publisher:Cengage Learning
Elementary Statistics: Picturing the World (7th E...
Statistics
ISBN:9780134683416
Author:Ron Larson, Betsy Farber
Publisher:PEARSON
The Basic Practice of Statistics
Statistics
ISBN:9781319042578
Author:David S. Moore, William I. Notz, Michael A. Fligner
Publisher:W. H. Freeman
Introduction to the Practice of Statistics
Statistics
ISBN:9781319013387
Author:David S. Moore, George P. McCabe, Bruce A. Craig
Publisher:W. H. Freeman