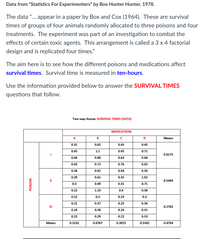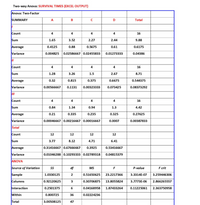
Choose the correct answers for the items listed below.
Response = [ Select ] ["Survival Times", "Medications", "Poisons"]
Row factor, number of levels = [ Select ] ["Poisons, 4", "Survival Times, 12", "Medications, 3", "Survival Times, 48", "Poisons, 3", "Medications, 4"]
Column factor, number of levels = [ Select ] ["Medications, 3", "Poisons, 4", "Medications, 4", "Poisons, 3", "Survival Times, 12", "Survival Times, 48"]
Number of treatments = number of samples = [ Select ] ["3", "4", "12", "48", "16"]
Number of subjects per sample = [ Select ] ["48", "3", "16", "12", "4"]
Total number of observations = [ Select ] ["16", "12", "4", "48", "3"]
Variance of the survival times for all animals given Medication D = [ Select ] ["0.01046288", "0.02789318", "0.04386", "0.00387833", "0.10293333", "0.04815379", "0.08373292"]
Total survival time for all animals given Poison III = [ Select ] ["4.42", "6.41", "8.12", "4.71", "8.71", "3.77", "9.88"]
Average survival time for animals given Poison II and Medication C = [ Select ] ["0.3925", "0.4125", "0.544375", "0.375"]


Trending nowThis is a popular solution!
Step by stepSolved in 2 steps

- 1. The General Social Survey asked 82 adults how many years of education they had. The sample mean was 13.37 years with a standard deviation of 3.13 years. Compute the margin of error to construct 96% confidence interval of mean years of education. 2. The General Social Survey asked 30 adults how many years of education they had. The sample mean was 13.37 years with a standard deviation of 3.13 years. Compute the margin of error to construct 99% confidence interval of mean years of education. Round to three decimal places. We are % confident that mean years of education is between and. .arrow_forwardErrors in medical prescriptions occur relatively frequently. In a study, two groups of doctors had similar err rates and one group switched to e-prescriptions while the other continued with hand-written prescriptions. C year later, the number of errors was measured. The results are given in the two-way table. No Error Error 254 Electronic 3594 Written 1478 2370 a). Fill in the row and column totals. b). What proportion of all the prescriptions had errors in them? c). What proportion of electronic prescriptions had errors in them? d). What proportion of written prescriptions had errors in them? e). What proportion of the prescriptions with errors were written prescriptions?arrow_forward2. A real estate expert wanted to find the relationship between the sale price of houses and various characteristics of the houses. He collected data on five variables, recorded in the table, for 12 houses that were sold recently. The five variables are: Sale price of a house in thousands of dollars. Size of the lot in acres. Price: Lot Size: Living Area: Living area in square feet. Age: Type of house: town house (T) or Villa (V) Age of a house in years. Price Lot Size Living Area Age Туре of house 255 1.4 2500 8 T 178 0.9 2250 12 T T. T. T. 263 1.8 2900 5 0.7 2.6 127 1800 24 305 3200 10 164 1.2 2400 18 245 2.1 2700 T V 146 1.1 2050 28 287 2.8 2850 13 V 189 1.6 2600 9 211 1.7 2300 8 V 123 0.5 1700 11 V a) Find the regression equation for the town house b) Find the regression equation for the Villa c) What is the price of a town house with a lot size of 1.3, living area of 1800, and is 7 years old? EBBBBE A> >}>l> >{arrow_forward
- Twenty-five randomly selected students were asked the number of movies they watched the previous week. The results are as follows. # of movies Frequency Relative Frequency Cumulative Relative Frequency 0 4 1 10 2 8 3 2 4 1 (a) Construct a histogram of the data. (b) Complete the columns of the chart. (Enter exact numbers as integers, fractions, or decimals.) # of movies Frequency Relative Frequency Cumulative Relative Frequency 0 4 1 10 2 8 3 2 4 1arrow_forwardHow to find independent and defendant variablesarrow_forwardA health-conscious company decides to make a trail mix out of almonds, dried cranberries, and chocolate-covered cashews. The nutritional information for these items is shown in the table below. Almonds Cranberries Cashews (per 10 pieces) (per 10 pieces) (per 10 pieces) Fat (g) 6. 0,02 Protein (g) 2 3.5 Carbohydrates (g) 8 5.5 For the "hiking" mix, there are 1,000 total pieces of mix. The total amount of protein is 55 g, and the total amount of fat is 131.6 g. If there are the same number of almonds as cashews, how many pieces of each item are in the trail mix? almonds pieces cranberries pieces cashews pieces Additional Materialsarrow_forward
- You are the Provost of a University and you want to see if students would like to participate in classroom-based physical activity. You implemented a quick pilot test and collected data after Spring quarter. Below is the first set of data. Based on the data, answer the question. Age (1-18-24 Participant Height (inches) Weight (pounds) Sex (1= male, 2 = female) Ever participated in classroom exercise (1= No, 2 = Yes) years, 2=25-34 years, 3 35-49 years, 4 50 years or older) 1 66 150 1 1 1 2 72 150 2 2 4 3 66 150 2 1 2 4 74 215 1 2 1 5 66 112 2 2 6 71 215 2 2 7 69 175 2 2 3 8 66 152 2 1 9 72 375 1 10 66 140 1 2 What type of variable is sex and age? dichotomous, ordinal dichotomous, nominal O nominal, discrete nominal, dichotomousarrow_forwardVirginia polled a large sample of individuals to find the percentage of students with known food allergies and the percentage of students without known food allergies. Which of the following could sufficiently display the data if only the two given categories are to be included? Select the correct answer below: bar graph pie chart either a pie chart or a bar graph neither a pie chart nor a bar grapharrow_forwardRBI Kings. As reported on MLB.com, the five players with the highest runs batted in (RBI) during the 2012 Major League Baseball season are listed in the following table. Also included are the teams for which they played, their positions, and their weights. Identify the type of data provided by the information in each column of the table. Player Team Position RBI Weight (lb) M. Cabrera Detroit 3B 139 240 J. Hamilton Texas LE 128 225 C. Headley San Diego 3B 115 220 R. Braun Milwaukee LE 112 205 E. Encamacion Toronto IB 110 230arrow_forward
- How would you "describe the population in this study? (Including the population size)arrow_forwardI need to find the population of the study. I know the population of the study is the group as a whole being researched. My topic is: The average annual income of states and the average cost of a four-year college degree. What would the population of the study be? All of the states? I am just confused.arrow_forward−13,−13,−13,0,0,0,11−13,−13,−13,0,0,0,11 Determine if the data set is unimodal, bimodal, multimodal, or has no mode. Identify the mode(s), if any exist.arrow_forward
 MATLAB: An Introduction with ApplicationsStatisticsISBN:9781119256830Author:Amos GilatPublisher:John Wiley & Sons Inc
 Probability and Statistics for Engineering and th...StatisticsISBN:9781305251809Author:Jay L. DevorePublisher:Cengage Learning
 Statistics for The Behavioral Sciences (MindTap C...StatisticsISBN:9781305504912Author:Frederick J Gravetter, Larry B. WallnauPublisher:Cengage Learning
 Elementary Statistics: Picturing the World (7th E...StatisticsISBN:9780134683416Author:Ron Larson, Betsy FarberPublisher:PEARSON
 The Basic Practice of StatisticsStatisticsISBN:9781319042578Author:David S. Moore, William I. Notz, Michael A. FlignerPublisher:W. H. Freeman
 Introduction to the Practice of StatisticsStatisticsISBN:9781319013387Author:David S. Moore, George P. McCabe, Bruce A. CraigPublisher:W. H. Freeman


