MATLAB: An Introduction with Applications
6th Edition
ISBN: 9781119256830
Author: Amos Gilat
Publisher: John Wiley & Sons Inc
expand_more
expand_more
format_list_bulleted
Concept explainers
Question
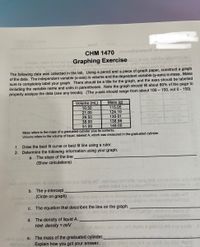
1 draw the best fit curve or best fit line using a ruler.
2. Determine the following information using your graph
A- the slope of the line. Show calculations
B- the y-intercept circle on the graph
C. The equations that describes the line on the graph
d: the density of the liquid A
E: the mass of the graduated cylinder.

Transcribed Image Text:ams
CHM 1470 seiae pirtqs@ toT
poiigeno Baslo-ni or not bee Graphing Exercise R MOV OvIn oN 10lbunniweY
1alimie 16quo dong no busrt yd igang a
sleb nworpl
bos easlo poinub bib uoy eno eri of
199ita
The following data was collected in the lab. Using a pencil and a piece of graph paper, construct a graph
of the data. The independent variable (x-axis) is volume and the dependent variable (y-axis) is mass. Make
sure to completely label your graph. There should be a title for the graph, and the axes should be labelled
including the variable name and units in parentheses. Note the graph should fill about 80% of the page to
properly analyze the data (see any trends). (The y-axis should range from about 100 – 150, not 0 - 150)
Mass (g)
Volume (mL)
10.50
21.00
29.50
38.00
51.00
115.05
124.10
130.01
138.98
148.00
Mass refers to the mass of a graduated cylinder plus its contents.
Volume refers to the volume of liquid, labeled A, which was measured in the graduated cylinder.
1. Draw the best fit curve or best fit line using a ruler.
2. Determine the following information using your graph.
a. The slope of the line
(Show calculations)
nwo i no beinhg en bluone palimdue dGRD orlTeignmaxe eirt 1ofte rigeng bne toenebeeige uOy Isbo
woted betail s1s 2ubec09 190x1o cmmue Asp
b. The y-intercept
amuloo bnooCircle on graph) bluone bns exe y a no beiqe
nmuloo ra silt no bereii ed bluorie eixs Xsd no berlosp ed
C. The equation that describes the line on the graph.
Tiw geg eteoa nsloa heen ni ned) bans 33
ed of eldshey insbrogeb er T
oldshev Insbaegebni et brua
sisb or damp01
d. The density of liquid A.
Hint: density =
ee
enrio sois e. The mass of the graduated cylinder.
etsngo Explain how you got your answer. d xod noltao elxs
Expert Solution
This question has been solved!
Explore an expertly crafted, step-by-step solution for a thorough understanding of key concepts.
This is a popular solution
Trending nowThis is a popular solution!
Step by stepSolved in 4 steps with 1 images

Knowledge Booster
Learn more about
Need a deep-dive on the concept behind this application? Look no further. Learn more about this topic, statistics and related others by exploring similar questions and additional content below.Similar questions
- Please answer with a neat presentation, so that it's easy to read. Also, if you can show your work so that I can see how to do the current and future problems like this. Thank you.arrow_forwardUse the Line Tool to graph the proportional relationship y = 4x. Line < Undo Redo X Reset y 10- 8- 4 2- X 2 4 6. 8. 10arrow_forwardTheme Transition D Background Layout- 1 2 1. Use the table to help you find the lateral and total surface area of the cylinder. Use 3.14 for pi. LATERAL SURFACE AREA TOTAL SURFACE AREA 13 units FORMULA PLUG IN #S 6 units SOLUTION OManeuvering the Middle LLC, 2017 Click to add speaker notes Terms of Use Sch Support | Schoology Blog | PRIVACY POLICY -> Co 23 24 & 3. 4. 5 7 8. 9. e y 10 d harrow_forward
arrow_back_ios
arrow_forward_ios
Recommended textbooks for you
 MATLAB: An Introduction with ApplicationsStatisticsISBN:9781119256830Author:Amos GilatPublisher:John Wiley & Sons Inc
 Probability and Statistics for Engineering and th...StatisticsISBN:9781305251809Author:Jay L. DevorePublisher:Cengage Learning
 Statistics for The Behavioral Sciences (MindTap C...StatisticsISBN:9781305504912Author:Frederick J Gravetter, Larry B. WallnauPublisher:Cengage Learning
 Elementary Statistics: Picturing the World (7th E...StatisticsISBN:9780134683416Author:Ron Larson, Betsy FarberPublisher:PEARSON
 The Basic Practice of StatisticsStatisticsISBN:9781319042578Author:David S. Moore, William I. Notz, Michael A. FlignerPublisher:W. H. Freeman
 Introduction to the Practice of StatisticsStatisticsISBN:9781319013387Author:David S. Moore, George P. McCabe, Bruce A. CraigPublisher:W. H. Freeman

MATLAB: An Introduction with Applications
Statistics
ISBN:9781119256830
Author:Amos Gilat
Publisher:John Wiley & Sons Inc

Probability and Statistics for Engineering and th...
Statistics
ISBN:9781305251809
Author:Jay L. Devore
Publisher:Cengage Learning

Statistics for The Behavioral Sciences (MindTap C...
Statistics
ISBN:9781305504912
Author:Frederick J Gravetter, Larry B. Wallnau
Publisher:Cengage Learning

Elementary Statistics: Picturing the World (7th E...
Statistics
ISBN:9780134683416
Author:Ron Larson, Betsy Farber
Publisher:PEARSON

The Basic Practice of Statistics
Statistics
ISBN:9781319042578
Author:David S. Moore, William I. Notz, Michael A. Fligner
Publisher:W. H. Freeman

Introduction to the Practice of Statistics
Statistics
ISBN:9781319013387
Author:David S. Moore, George P. McCabe, Bruce A. Craig
Publisher:W. H. Freeman