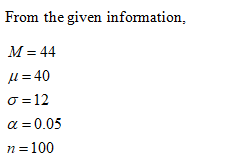
Childhood participation in sports, cultural groups and youth groups appears to be related to improved self-esteem for adolescents (McGee et al., 2006). A sample of n =100 adolescents with a history of group participation is given a standardized self-esteem questionnaire. For the general population of adolescents, scores on this questionnaire form a
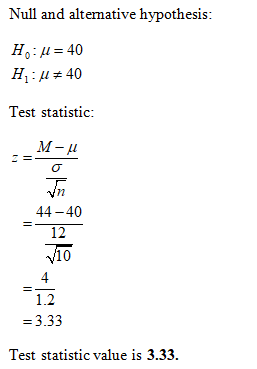
Is there enough evidence to conclude that self-esteem scores for these adolescents are significantly different from those of the general population? Use a two-tailed test with α=.05.
The null hypothesis in symbols is


Step by stepSolved in 3 steps with 3 images

- 1) A study compared the weight loss of people on a low-fat diet versus people on a low-carb diet. In a sample of 100 obese people on a low-fat diet the sample mean weight loss as 7.6 pounds with a standard deviation of 3.2 pounds. In another sample of 120 obese people on a low-carb diet the sample mean weight loss was 6.7 pounds with a standard deviation of 3.9 pounds. a) Test the hypothesis, at the 5% level of significance, that there is a difference in the mean weight loss of using the 2 different diets. b) What is the p-value?arrow_forwardIn a test of the effectiveness of garlic for lowering cholesterol, 36 subjects were treated with raw garlic Cholesterol levels were measured before and after the treatment. The changes (before minus after) in their levels of LDL cholesterol (in mg/dL) have a mean of 0.1 and a standard deviation of 23.2. Use a 0.01 significance level to test the claim that with garlic treatment, the mean change in LDL cholesterol is greater than 0. What do the results suggest about the effectiveness of the garlic treatment? Assume that a simple random sample has been selected. Identify the null and alternative hypotheses, test statistic, P-value, and state the final conclusion that addresses the original claim. What are the null and alternative hypotheses? O A. Ho p=0 mg/dL O B. H, p=0mg/dL H, p0 mg/dL OC. Ho H>0 mg/dL O D. H, p=0 mg/dL. H, pz0 mg/dL. H, p<0 mg/dLarrow_forwardThe National Assessment of Educational Progress (NAEP) is a nationwide assessment of students' proficiency in nine subjects: mathematics, reading, writing, science, the arts, civics, economics, geography, and U.S. history. The main NAEP assessments are conducted annually on samples of students from grades 4, 8, and 12. Suppose in 2000, the science scores for female students had a mean of 146 with a standard deviation of 35. Assume that these scores are normally distributed with the given mean and standard deviation. The normal curve representing this distribution of the scores is symmetrical about a vertical line through . The value 41 is below the mean, and the value 251 is above the mean. The area under the curve between 41 and 251 is approximately . Similarly, 95.44% of the female students scored between and .arrow_forward
- Nutrition Iron-deficiency anemia is an important nutritional health problem in the United States. A dietary assessment was performed on 56 boys 9 to 11 years of age whose families were below the poverty level. The mean daily iron intake among these boys was found to be 12.40 mg with standard deviation 4.71 mg. Suppose the mean daily iron intake among a large population of 9- to 11-year-old boys from all income strata is 14.41 mg. We want to test whether the mean iron intake among the low-income group is different from that of the general population. You can use the Inferential Statistics page and the Distribution Calculators page in SALT to answer parts of this question. (a) State the hypotheses (in mg) that we can use to consider this question. (Enter != for as needed.) Ho: H₁: (b) Carry out the hypothesis test in part (a) using the critical-value method with an a level of 0.05, and summarize your findings. Find the test statistic. (Round your answer to two decimal places.) Find the…arrow_forwardIs narcissism a more common personality trait today than it was a few decades ago? It is known that the mean population score on the Narcissistic Personality Inventory (NPI) for students attending University of South Alabama around 20 years ago was μ= 15 (Twenge, 2010). Interested in the narcissism levels of students in the year 2020, a researcher administers the NPI to a random sample of 25 University of Alabama sophomores this Spring term. The mean NPI score from the researcher’s sample of sophomores is M = 16.5, with s = 3.4. 1. Write the null and alternative hypotheses in symbols. Possible symbols for your answer: H0, H1, μ, M, σ. 2. Calculate the standard error. 3. Find the critical value for the test statistic, assuming alpha = .05 (Use largest [i.e., most conservative] value if exact value not given in the chart) a) 2.064 b) 1.96 c) 1.98 d) 2.000arrow_forwardBone mineral density (BMD) is a measure of bone strength. Studies show that BMD declines after age 45. The impact of exercise may increase BMD. A random sample of 59 women between the ages of 41 and 45 with no major health problems were studied. The women were classified into one of two groups based upon their level of exercise activity: walking women and sedentary women. The 39 women who walked regularly had a mean BMD of 5.96 with a standard deviation of 1.22. The 20 women who are sedentary had a mean BMD of 4.41 with a standard deviation of 1.02. Which of the following inference procedures could be used to estimate the difference in the mean BMD for these two types of womenarrow_forward
- Dr. Graham is interested in determining if middle-aged adults use text messaging more or less frequently than the general population. Dr. Graham collects information on text messaging from a random sample of 50 adults ages 25 to 44. Dr. Graham finds that these individuals send or receive an average of 68 text messages per day. Using the population mean (and standard deviation) of 41.5 texts per day (34 texts per day), determine whether adults in this age group use text messaging more than the general public.arrow_forwardIn a test of the effectiveness of garlic for lowering cholesterol, 4949 subjects were treated with raw garlic. Cholesterol levels were measured before and after the treatment. The changes (before minus after) in their levels of LDL cholesterol (in mg/dL) have a mean of 0.30.3 and a standard deviation of 2.142.14 Use a 0.100.10 significance level to test the claim that with garlic treatment, the mean change in LDL cholesterol is greater than 00. What do the results suggest about the effectiveness of the garlic treatment? Assume that a simple random sample has been selected. Identify the null and alternative hypotheses, test statistic, P-value, and state the final conclusion that addresses the original claim. What are the null and alternative hypotheses? A. Upper H 0H0: muμequals=00 mg/dL Upper H 1H1: muμless than<00 mg/dL B. Upper H 0H0: muμequals=00 mg/dL Upper H 1H1: muμgreater than>00 mg/dL C. Upper H 0H0: muμequals=00 mg/dL Upper…arrow_forwardIn a test of the effectiveness of garlic for lowering cholesterol, 4949 subjects were treated with raw garlic. Cholesterol levels were measured before and after the treatment. The changes (before minus after) in their levels of LDL cholesterol (in mg/dL) have a mean of 0.40.4 and a standard deviation of 23.823.8. Use a 0.010.01 significance level to test the claim that with garlic treatment, the mean change in LDL cholesterol is greater than 00. What do the results suggest about the effectiveness of the garlic treatment? Assume that a simple random sample has been selected. Identify the null and alternative hypotheses, test statistic, P-value, and state the final conclusion that addresses the original claim. Determine the test statistic. nothing (Round to two decimal places as needed.)arrow_forward
 MATLAB: An Introduction with ApplicationsStatisticsISBN:9781119256830Author:Amos GilatPublisher:John Wiley & Sons Inc
 Probability and Statistics for Engineering and th...StatisticsISBN:9781305251809Author:Jay L. DevorePublisher:Cengage Learning
 Statistics for The Behavioral Sciences (MindTap C...StatisticsISBN:9781305504912Author:Frederick J Gravetter, Larry B. WallnauPublisher:Cengage Learning
 Elementary Statistics: Picturing the World (7th E...StatisticsISBN:9780134683416Author:Ron Larson, Betsy FarberPublisher:PEARSON
 The Basic Practice of StatisticsStatisticsISBN:9781319042578Author:David S. Moore, William I. Notz, Michael A. FlignerPublisher:W. H. Freeman
 Introduction to the Practice of StatisticsStatisticsISBN:9781319013387Author:David S. Moore, George P. McCabe, Bruce A. CraigPublisher:W. H. Freeman


