
A First Course in Probability (10th Edition)
10th Edition
ISBN: 9780134753119
Author: Sheldon Ross
Publisher: PEARSON
expand_more
expand_more
format_list_bulleted
Related questions
Concept explainers
Question
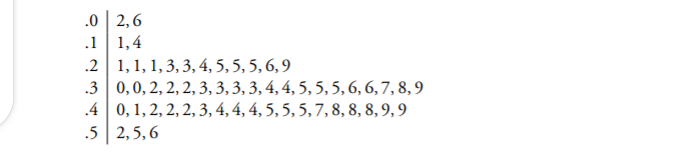
25. A chemical engineer desiring to study the evaporation rate of water from brine
evaporation beds obtained data on the number of inches of evaporation in each
of 55 July days spread over 4 years. The data are given in the following stem and
leaf plot, which shows that the smallest data value was .02 inches, and the largest
.56 inches.
Find the
(a) sample mean;
(b) sample median ;
(c) sample standard deviation of these data.
(d) Do the data appear to be approximately normal?
(e) What percentage of data values are within 1 standard deviation of the mean?

Transcribed Image Text:.0 2,6
.1 1,4
.2 1,1, 1, 3, 3, 4, 5, 5, 5, 6, 9
.3 0,0, 2, 2, 2, 3, 3, 3, 3, 4, 4, 5, 5, 5, 6, 6,7, 8, 9
.4 0, 1, 2, 2, 2, 3, 4, 4, 4, 5, 5, 5,7, 8, 8, 8, 9, 9
.5 2,5,6
Expert Solution
This question has been solved!
Explore an expertly crafted, step-by-step solution for a thorough understanding of key concepts.

Step by stepSolved in 2 steps with 1 images

Knowledge Booster


Learn more about
Need a deep-dive on the concept behind this application? Look no further. Learn more about this topic, probability and related others by exploring similar questions and additional content below.Similar questions
- Methyl t-butyl ether (MTBE) is an organic water contaminant that often results from gasoline spills. The level of MTBE (in parts per billion) was measured for a sample of 12 well sites located near the ship channel during a recent spilI. The data are: 150, 376, 38, 12, 11, 134, 12, 251, 63, 8, 13, 107. (a) Find the sample mean and the sample standard deviation. (b) Construct and interpret a 91.85% and 98.15% confidence interval for the population mean by using the following equations: B, = x – t - - and By = x +t N sample N sample (c) Which confidence interval is wider and why?arrow_forwardThe lengths of nails produced in a factory are normally distributed with a mean of 3.343.34 centimeters and a standard deviation of 0.070.07 centimeters. Find the two lengths that separate the top 3%3% and the bottom 3%3%.arrow_forward3. Based on a recent study, the pH level of the arterial cord (one vessel in the umbilical cord) is normally distributed with mean 7.23 and standard deviation of 0.11. Find the percentage of preterm infants who have the following arterial cord pH levels. a. pH levels between 7.00 and7.50. b. pH levels over 7.31.arrow_forward
- 7. Calculate -scores for the following raw scores taken from a population with a mean of 100 and standard deviation of 16: 112, 109, 56, 88, 135, 99 Answer: 2 = 0.75, 0.56, -2.75, -0.75, 2.19, -0.06 show work for these pleasearrow_forwardFor each day of last year, the number of vehicles passing through a certain intersection was recorded by a city engineer. One objective of this study was to determine the percentage of days that more than 425 vehicles used the intersection. If the mean data was 375 vehicles per day and the standard deviation was 25 vehicles: (c) Suppose the relative frequency distribution for the data is bell-shaped, then what percentage of days between 325 and 425 vehicles used the intersection ?arrow_forwardSuppose that you had collected the following sample data (in inches) on the diameters of tree trunks, measured at waist level and growing at 2000’ elevation in the Cascade Mountains: 9.0, 6.2, 6.5, 7.0, 10.5 and 8.8. The sample Inter Quartile Range is: (a) 5.5 (b) 4.5 (c) 3.5 (d) 2.5 (e) 4.0 (f) None of the abovearrow_forward
arrow_back_ios
arrow_forward_ios
Recommended textbooks for you
- A First Course in Probability (10th Edition)ProbabilityISBN:9780134753119Author:Sheldon RossPublisher:PEARSON

A First Course in Probability (10th Edition)
Probability
ISBN:9780134753119
Author:Sheldon Ross
Publisher:PEARSON