Characteristic # of people DISABILITY STATUS OF THE CIVILIAN NONINSTITUTIONALIZED POPULATION Total Civilian Noninstitutionalized Population With a disability 316,027,641 39,792,082 73,463,859 3,054,559 Under 18 years a disability 196,138,799 20,276, 199 18 to 64 years With a disability 65 years and over With a disability 46,424,983 16.461.324
Characteristic # of people DISABILITY STATUS OF THE CIVILIAN NONINSTITUTIONALIZED POPULATION Total Civilian Noninstitutionalized Population With a disability 316,027,641 39,792,082 73,463,859 3,054,559 Under 18 years a disability 196,138,799 20,276, 199 18 to 64 years With a disability 65 years and over With a disability 46,424,983 16.461.324

MATLAB: An Introduction with Applications
6th Edition
ISBN:9781119256830
Author:Amos Gilat
Publisher:Amos Gilat
Chapter1: Starting With Matlab
Section: Chapter Questions
Problem 1P

Related questions
Question

Transcribed Image Text:0.96
QUESTION 8
Given that an individual is age 65 years and over, find the probability that the person does not have a disability
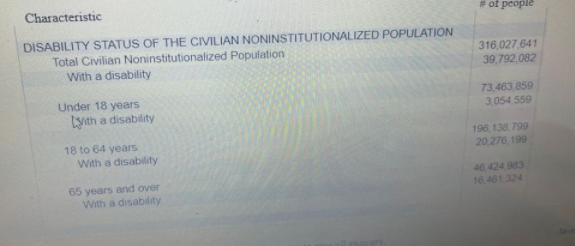
5. Disability Status of the Civilian Noninstitutionalized Population
Characteristic
# of people
DISABILITY STATUS OF THE CIVILIAN NONINSTITUTIONALIZED POPULATION
Total Civilian Noninstitutionalized Population
With a disability
316,027,641
39,792,082
Under 18 years
With a disability
73,463,859
3,054,559
18 to 64 years
With a disability
196,138,799
20,276, 199
65 years and over
With a disabllity
46,424,983
16,461,324
Save All Answers
Click Saue and Submit to save ard submit. Click Save All Answers to save all ansuers.
11 F
O O
99+
ere to search
Expert Solution
Step 1
Given data,

Trending now
This is a popular solution!

Step by step
Solved in 2 steps with 1 images

Recommended textbooks for you
MATLAB: An Introduction with Applications
Statistics
ISBN:
9781119256830
Author:
Amos Gilat
Publisher:
John Wiley & Sons Inc

Probability and Statistics for Engineering and th…
Statistics
ISBN:
9781305251809
Author:
Jay L. Devore
Publisher:
Cengage Learning

Statistics for The Behavioral Sciences (MindTap C…
Statistics
ISBN:
9781305504912
Author:
Frederick J Gravetter, Larry B. Wallnau
Publisher:
Cengage Learning
MATLAB: An Introduction with Applications
Statistics
ISBN:
9781119256830
Author:
Amos Gilat
Publisher:
John Wiley & Sons Inc
Probability and Statistics for Engineering and th…
Statistics
ISBN:
9781305251809
Author:
Jay L. Devore
Publisher:
Cengage Learning
Statistics for The Behavioral Sciences (MindTap C…
Statistics
ISBN:
9781305504912
Author:
Frederick J Gravetter, Larry B. Wallnau
Publisher:
Cengage Learning

Elementary Statistics: Picturing the World (7th E…
Statistics
ISBN:
9780134683416
Author:
Ron Larson, Betsy Farber
Publisher:
PEARSON

The Basic Practice of Statistics
Statistics
ISBN:
9781319042578
Author:
David S. Moore, William I. Notz, Michael A. Fligner
Publisher:
W. H. Freeman

Introduction to the Practice of Statistics
Statistics
ISBN:
9781319013387
Author:
David S. Moore, George P. McCabe, Bruce A. Craig
Publisher:
W. H. Freeman