MATLAB: An Introduction with Applications
6th Edition
ISBN: 9781119256830
Author: Amos Gilat
Publisher: John Wiley & Sons Inc
expand_more
expand_more
format_list_bulleted
Topic Video
Question

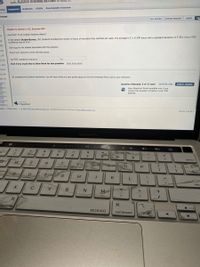
Transcribed Image Text:Lock, Statistics: Unlocking the Power of Bata, 20
ORION
Downloadable eTextbook
actice Assignment Gradebook
gnment
FULL SCREEN
PRINTER VERSION
BACK
Chapter 6, Section 2-CI, Exercise 092
How Much TV Do College Students Watch?
In the dataset StudentSurvey, 361 students recorded the number of hours of television they watched per week. The average is = 6.504 hours with a standard deviation of 5.584. Find a 90%
confidence interval for .
CI.
-CI.
Click here for the dataset associated with this question.
CI.
Round your answers to three decimal places.
1-CI.
1-CI.
The 90% confidence interval is
to
n 1-CI.
Click if you would like to Show Work for this question: Open Show Work
on 1-0.
on 1-D,
By accessing this Question Assistance, you will learn while you earn points based on the Point Potential Policy set by your instructor.
cion 1-0.
tion 1-
46
ction 1-
D47
ction 1
048
Cection 1-
050
Section 1-
056
Section 1-
Question Attempts: 0 of 15 used
SAVE FOR LATER
SUBMIT ANSWER
Earn Maximum Points available only if you
answer this question correctly in your first
attempt.
%
powered by
MapleNet
ment I Privacy Policy I 2000-2020 John Wiley A Sons. Inc. All Rights Reserved. A Division of John Wiley & Sons. Inc.
Version 4.24.20.1
MacBook Pro
The
I'm
**
%23
$4
4
&
3
6
7
8.
9
delete
W
E
R
Y
S
D
G
J
K
retu
C
V
M
mmand
MOSISO
command
option

Transcribed Image Text:A edugen.wileyplus.com
E essay 2 - Goog.
O Toosii - Pain &.
5 My Blackboard.
A. India - total p.
w WileyPLUS
Thread: "Dedu.
E The relationshi.
Interconnected.
WileyPLUS: MyWileyPLUS I Help I Contact Us I Lo
ELEMENTS OF STATISTICS (MATH 1
Lock, Statistics: Unlocking the Power of Data, 2e
tice
Gradebook
Downloadable eTextbook
Assignment
ORION
ment
FULL SCREEN
PRINTER VERSION
1 BACK
NEXT
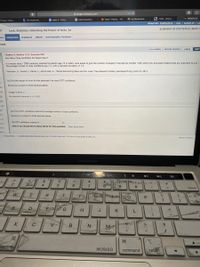
Chapter 6, Section 2-CI, Exercise 093
How Many Close Confidants Do People Have?
In a recent study,' 2006 randomly selected US adults (age 18 or older) were asked to give the number of people in the last six months "with whom you discussed matters that are important to you."
The average number of close confidants was 2.2, with a standard deviation of 1.4.
1Hampton, K., Goulet, L., Rainie, L., and Purcell, K., "Social Networking Sites and Our Lives," Pew Research Center, pewresearch.org, June 16, 2011.
(a) Find the margin of error for this estimate if we want 95% confidence.
Round your answer to three decimal places.
CL.
CL.
margin of error =
-D.
the absolute tolerance is +/-0.005
-D.
1-D.
(b) Find a 95% confidence interval for average number of close confidants.
Round your answers to three decimal places.
The 95% confidence interval is
to
on 1-
Click if you would like to Show Work for this question: Open Show Work
on 1-
ion 1-
BI Privacy Policy 2000-2020 John Wiley & Sons, Inc. All Rights Reserved. A Division of John Wiley & Sons, Inc.
Version 4.24.20.1
MacBook Pro
The
(I'm
)
%23
$
&
*
2
3
4
6
7
8.
6.
delete
DE W
R
Y
U.
O.
P.
F G
H
J
K
C
V
M
mmand
MOSISO
command
option
S1
Expert Solution
This question has been solved!
Explore an expertly crafted, step-by-step solution for a thorough understanding of key concepts.
This is a popular solution
Trending nowThis is a popular solution!
Step by stepSolved in 2 steps

Knowledge Booster
Learn more about
Need a deep-dive on the concept behind this application? Look no further. Learn more about this topic, statistics and related others by exploring similar questions and additional content below.Similar questions
- Each of the variables displayed in the histograms below has a mean of 14.5, a range of 8, and 59 observations. Rank the three variables according to their standard deviations, from the smallest to the largest.arrow_forwardYou measure 40 turtles' weights, and find they have a mean weight of 66 ounces. Assume the population standard deviation is 13.5 ounces. Based on this, construct a 99% confidence interval for the true population mean turtle weight. Give your answers as decimals, to two places + ouncesarrow_forwardYou measure 38 textbooks' weights, and find they have a mean weight of 58 ounces. Assume the population standard deviation is 3.9 ounces. Based on this, construct a 90% confidence interval for the true population mean textbook weight .arrow_forward
- Construct a 96% confidence interval if x=75 and n=200. Round your answers to 3 decimal places.arrow_forwardsection 6.2, stats (help with TI-84 calculator is possible) The gas mileages (in miles per gallon) of 23 randomly selected sports cars are listed in the accompanying table. Assume the mileages are not normally distributed. Use the standard normal distribution or the t-distribution to construct a 90% confidence interval for the population mean. Justify your decision. If neither distribution can be used, explain why. Interpret the results. Here are the sports car mileage averages: 19,28,19,17,20,22,16,24,27.20,18,26,25,24,18,16,20,22,20,18,24,19,17 Let standard deviation stand for population standard deviation and let n be the sample size. which distribution should be used to construct the confidence interval? 1) A (t-distribution, the standard normal distribution should, or neither distribution can) be used to construct the confidence interval, since 2) is (stanard dev. and n greater than or equal to 10., standard is unknown and the population is not normally distributed.,…arrow_forwardIn a random sample of 2500 men being treated for obesity, the mean total cholesterol level is 175 with a standard deviation of 25. Construct a 95% confidence interval around the mean and interpret it. Use the context of the question please.arrow_forward
- You measure 37 textbooks' weights, and find they have a mean weight of 69 ounces. Assume the population standard deviation is 12.9 ounces. Based on this, construct a 80% confidence interval for the true population mean textbook weight.Report your answers to three decimal places.arrow_forwardFind z* for a confidence level of 83%. Give your answer to 3 decimal places.arrow_forwardYou measure 31 turtles' weights, and find they have a mean weight of 64 ounces. Assume the population standard deviation is 14.6 ounces. Based on this, construct a 95% confidence interval for the true population mean turtle weight. Give your answers as decimals, to two places ouncesarrow_forward
arrow_back_ios
arrow_forward_ios
Recommended textbooks for you
 MATLAB: An Introduction with ApplicationsStatisticsISBN:9781119256830Author:Amos GilatPublisher:John Wiley & Sons Inc
 Probability and Statistics for Engineering and th...StatisticsISBN:9781305251809Author:Jay L. DevorePublisher:Cengage Learning
 Statistics for The Behavioral Sciences (MindTap C...StatisticsISBN:9781305504912Author:Frederick J Gravetter, Larry B. WallnauPublisher:Cengage Learning
 Elementary Statistics: Picturing the World (7th E...StatisticsISBN:9780134683416Author:Ron Larson, Betsy FarberPublisher:PEARSON
 The Basic Practice of StatisticsStatisticsISBN:9781319042578Author:David S. Moore, William I. Notz, Michael A. FlignerPublisher:W. H. Freeman
 Introduction to the Practice of StatisticsStatisticsISBN:9781319013387Author:David S. Moore, George P. McCabe, Bruce A. CraigPublisher:W. H. Freeman

MATLAB: An Introduction with Applications
Statistics
ISBN:9781119256830
Author:Amos Gilat
Publisher:John Wiley & Sons Inc

Probability and Statistics for Engineering and th...
Statistics
ISBN:9781305251809
Author:Jay L. Devore
Publisher:Cengage Learning

Statistics for The Behavioral Sciences (MindTap C...
Statistics
ISBN:9781305504912
Author:Frederick J Gravetter, Larry B. Wallnau
Publisher:Cengage Learning

Elementary Statistics: Picturing the World (7th E...
Statistics
ISBN:9780134683416
Author:Ron Larson, Betsy Farber
Publisher:PEARSON

The Basic Practice of Statistics
Statistics
ISBN:9781319042578
Author:David S. Moore, William I. Notz, Michael A. Fligner
Publisher:W. H. Freeman

Introduction to the Practice of Statistics
Statistics
ISBN:9781319013387
Author:David S. Moore, George P. McCabe, Bruce A. Craig
Publisher:W. H. Freeman