
MATLAB: An Introduction with Applications
6th Edition
ISBN: 9781119256830
Author: Amos Gilat
Publisher: John Wiley & Sons Inc
expand_more
expand_more
format_list_bulleted
Related questions
Concept explainers
Question

Transcribed Image Text:Pro
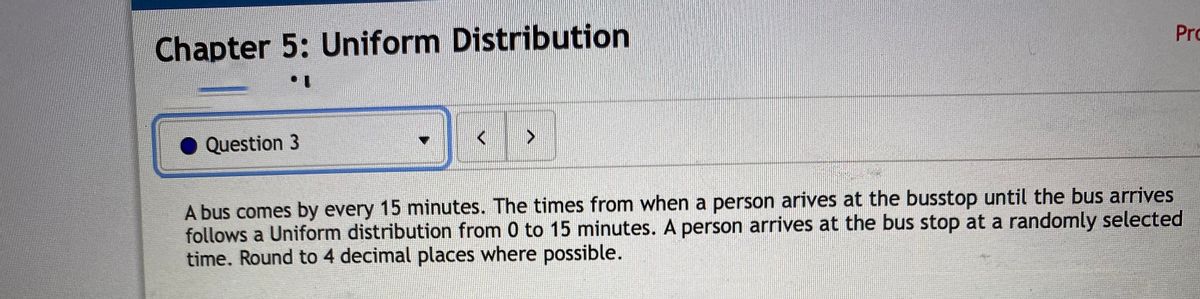
Chapter 5: Uniform Distribution
• Question 3
A bus comes by every 15 minutes. The times from when a person arives at the busstop until the bus arrives
follows a Uniform distribution from 0 to 15 minutes. A person arrives at the bus stop at a randomly selected
time. Round to 4 decimal places where possible.

Transcribed Image Text:d. Suppose that the person has already been waiting for 2 minutes. Find the probability that the person's
total waiting time will be between 5.4 and 7.6 minutes
e. 60% of all customers wait at least how long for the train?
minutes.
Hint:
Written Hint Z
Expert Solution
This question has been solved!
Explore an expertly crafted, step-by-step solution for a thorough understanding of key concepts.

This is a popular solution

Trending nowThis is a popular solution!

Step by stepSolved in 2 steps

Knowledge Booster


Learn more about
Need a deep-dive on the concept behind this application? Look no further. Learn more about this topic, statistics and related others by exploring similar questions and additional content below.Similar questions
- estion 4 of 7, Step 1 of 1 Correct inston has just received his monthly credit card statement. He placed 7 charges on his card in the last month with a mean of $21.09 er charge. He knows that 6 of the charges were as follows: $21.49, $22.40, $17.40, $21.76, $15.86, $16.40 petermine the amount of the 7th charge. Copy Data 用 Tables E Keypa nswer How to enter your answer (opens in new window) Keyboard Short Submit Answearrow_forwardTwo friends enroll in the same math course at the university they are attending. On the first exam Sam scores 35 (the mean in this class is 34 with a standard deviation of 15). Rob's score is at the 45th percentile for the class. Assume the exam scores have a symmetric shape. Who scored higher in the class? Question 4 options: Rob Not enough information to decide Sam They have approximately the same scorearrow_forwardd. find-t50,.01. Draw the distribution and locate the t-value (-t50,.01) in the distribution. e. find X²0,05. Draw the distribution and locate the x²-value (x20,05) in the distribution. f. find F2,20,.05. Draw the distribution and locate the F-value (F2,20,05) in the distribution.arrow_forward
- The response to a question has three alternatives: a, b , and c. A sample of responses provides 66 a 18 B , 36 c , and . Show the frequency and relative frequency distributions (use 2 decimal for the relative frequency column). Class Frequency Relative Frequency A B C Totalarrow_forwardNext question Use the given qualitative data to construct the relative frequency distribution. The 2324 people aboard a ship that sank include 276 male survivors, 1553 males who died, 362 female survivors, and 133 females who died. Complete the relative frequency distribution below. Relative Category Frequency Male survivors % Males who died % Female survivors % Females who died % (Round to one decimal place as needed.)arrow_forwardPlease do not give solution in image format thanku A car salesman collected data on how many cars were sold at a dealership per day for two weeks. The results were as follows: 6, 7, 4, 3, 1, 2, 6, 6, 6, 7, 4, 4. Make a frequency table and then make a histogram based on that frequency table. What is the shape of the distribution? O Skewed to the right O Skewed to the left O Bimodal O Symmetricalarrow_forward
- The following frequency distribution represents the scores on a math test. Find the class midpoint of scores for the interval 40-59. Number of Students 2 4 Scores 0-19 20-39 40-59 60-79 80-99 OA 49.0 OB. 49.5 OC. 48.5 OD. 50.5 655 Carrow_forwardn The gas mileages (in miles per gallon) for 26 cars are shown in the frequency distribution. Approximate the mean of the frequency distribution. Gas Mileage (in miles per gallon) Frequency 8 29-32 33-36 13 37-40 1 41-44 4 ... The approximate mean of the frequency distribution is (Round to one decimal place as needed.)arrow_forwardThe data represent the time, in minutes, spent reading a political blog in a day. Construct a frequency distribution using 5 classes. In the table, include the midpoints, relative frequencies, and cumulative frequencies. Which class has the greatest frequency and which has the least frequency? 15 14 4 7 19 1 16 1 12 17 17 18 14 10 10 Complete the table, starting with the lowest class limit. (Simplify your answers.) Relative Frequency Cumulative Frequency Class Frequency Midpoint Which class has the greatest frequency? The class with the greatest frequency is from to. Which class has the least frequency? The class with the least frequency is from toarrow_forward
arrow_back_ios
SEE MORE QUESTIONS
arrow_forward_ios
Recommended textbooks for you
- MATLAB: An Introduction with ApplicationsStatisticsISBN:9781119256830Author:Amos GilatPublisher:John Wiley & Sons Inc
 Probability and Statistics for Engineering and th...StatisticsISBN:9781305251809Author:Jay L. DevorePublisher:Cengage Learning
 Statistics for The Behavioral Sciences (MindTap C...StatisticsISBN:9781305504912Author:Frederick J Gravetter, Larry B. WallnauPublisher:Cengage Learning
  Elementary Statistics: Picturing the World (7th E...StatisticsISBN:9780134683416Author:Ron Larson, Betsy FarberPublisher:PEARSON
 The Basic Practice of StatisticsStatisticsISBN:9781319042578Author:David S. Moore, William I. Notz, Michael A. FlignerPublisher:W. H. Freeman
 Introduction to the Practice of StatisticsStatisticsISBN:9781319013387Author:David S. Moore, George P. McCabe, Bruce A. CraigPublisher:W. H. Freeman
MATLAB: An Introduction with Applications
Statistics
ISBN:9781119256830
Author:Amos Gilat
Publisher:John Wiley & Sons Inc
Probability and Statistics for Engineering and th...
Statistics
ISBN:9781305251809
Author:Jay L. Devore
Publisher:Cengage Learning
Statistics for The Behavioral Sciences (MindTap C...
Statistics
ISBN:9781305504912
Author:Frederick J Gravetter, Larry B. Wallnau
Publisher:Cengage Learning
Elementary Statistics: Picturing the World (7th E...
Statistics
ISBN:9780134683416
Author:Ron Larson, Betsy Farber
Publisher:PEARSON
The Basic Practice of Statistics
Statistics
ISBN:9781319042578
Author:David S. Moore, William I. Notz, Michael A. Fligner
Publisher:W. H. Freeman
Introduction to the Practice of Statistics
Statistics
ISBN:9781319013387
Author:David S. Moore, George P. McCabe, Bruce A. Craig
Publisher:W. H. Freeman