
Algebra and Trigonometry (6th Edition)
6th Edition
ISBN: 9780134463216
Author: Robert F. Blitzer
Publisher: PEARSON
expand_more
expand_more
format_list_bulleted
Related questions
Concept explainers
Question
Question 3-
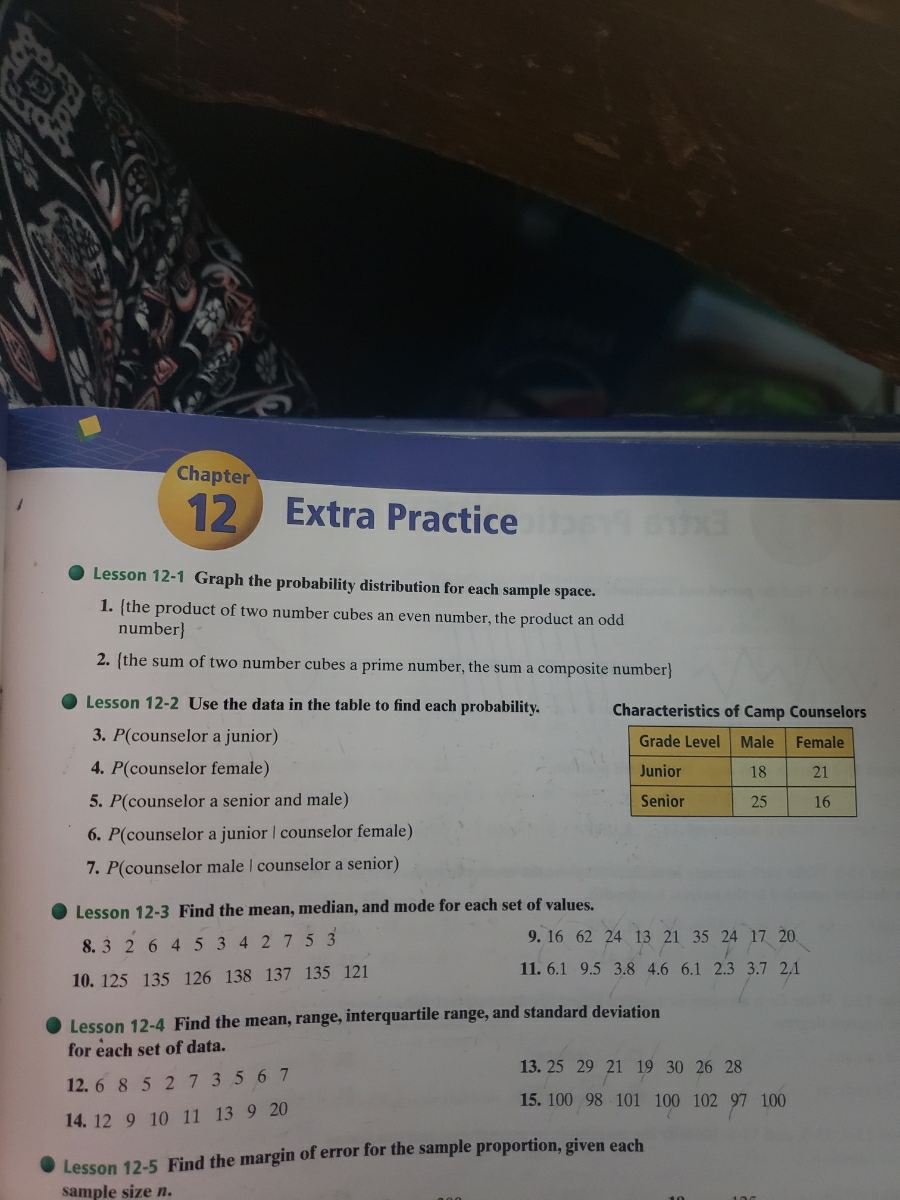

Transcribed Image Text:Chapter
12
Extra Practice
Lesson 12-1 Graph the probability distribution for each sample space.
1. (the product of two number cubes an even number, the product an odd
number}
2. (the sum of two number cubes a prime number, the sum a composite number}
Lesson 12-2 Use the data in the table to find each probability.
Characteristics of Camp Counselors
3. P(counselor a junior)
Grade Level
Male
Female
4. P(counselor female)
Junior
18
21
5. P(counselor a senior and male)
Senior
25
16
6. P(counselor a junior I counselor female)
7. P(counselor male | counselor a senior)
O Lesson 12-3 Find the mean, median, and mode for each set of values.
9. 16 62 24 13 21 35 24 17 20
8. 3 26 4534275 3
11. 6.1 9.5 3.8 4.6 6.1 2.3 3.7 2,1
10. 125 135 126 138 137 135 121
O Lesson 12-4 Find the mean, range, interquartile range, and standard deviation
for each set of data.
13. 25 29 21 19 30 26 28
12. 6 8 527 3567
15. 100 98 101 100 102 97 100
14. 12 9 10 11 13 9 20
Lesson 12-5 Find the margin of error for the sample proportion, given each
sample size n.
Expert Solution
This question has been solved!
Explore an expertly crafted, step-by-step solution for a thorough understanding of key concepts.

This is a popular solution

Trending nowThis is a popular solution!

Step by stepSolved in 4 steps with 4 images

Knowledge Booster


Learn more about
Need a deep-dive on the concept behind this application? Look no further. Learn more about this topic, algebra and related others by exploring similar questions and additional content below.Similar questions
Recommended textbooks for you
- Algebra and Trigonometry (6th Edition)AlgebraISBN:9780134463216Author:Robert F. BlitzerPublisher:PEARSON
 Contemporary Abstract AlgebraAlgebraISBN:9781305657960Author:Joseph GallianPublisher:Cengage Learning
 Linear Algebra: A Modern IntroductionAlgebraISBN:9781285463247Author:David PoolePublisher:Cengage Learning
  Algebra And Trigonometry (11th Edition)AlgebraISBN:9780135163078Author:Michael SullivanPublisher:PEARSON
 Introduction to Linear Algebra, Fifth EditionAlgebraISBN:9780980232776Author:Gilbert StrangPublisher:Wellesley-Cambridge Press
 College Algebra (Collegiate Math)AlgebraISBN:9780077836344Author:Julie Miller, Donna GerkenPublisher:McGraw-Hill Education
Algebra and Trigonometry (6th Edition)
Algebra
ISBN:9780134463216
Author:Robert F. Blitzer
Publisher:PEARSON
Contemporary Abstract Algebra
Algebra
ISBN:9781305657960
Author:Joseph Gallian
Publisher:Cengage Learning
Linear Algebra: A Modern Introduction
Algebra
ISBN:9781285463247
Author:David Poole
Publisher:Cengage Learning
Algebra And Trigonometry (11th Edition)
Algebra
ISBN:9780135163078
Author:Michael Sullivan
Publisher:PEARSON
Introduction to Linear Algebra, Fifth Edition
Algebra
ISBN:9780980232776
Author:Gilbert Strang
Publisher:Wellesley-Cambridge Press
College Algebra (Collegiate Math)
Algebra
ISBN:9780077836344
Author:Julie Miller, Donna Gerken
Publisher:McGraw-Hill Education