
MATLAB: An Introduction with Applications
6th Edition
ISBN: 9781119256830
Author: Amos Gilat
Publisher: John Wiley & Sons Inc
expand_more
expand_more
format_list_bulleted
Related questions
Question
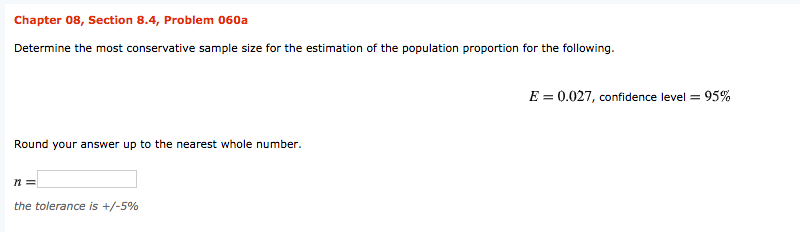

Transcribed Image Text:Chapter 08, Section 8.4, Problem 060a
Determine the most conservative sample size for the estimation of the population proportion for the following.
E = 0.027, confidence level = 95%
Round your answer up to the nearest whole number.
the tolerance is +/-5%
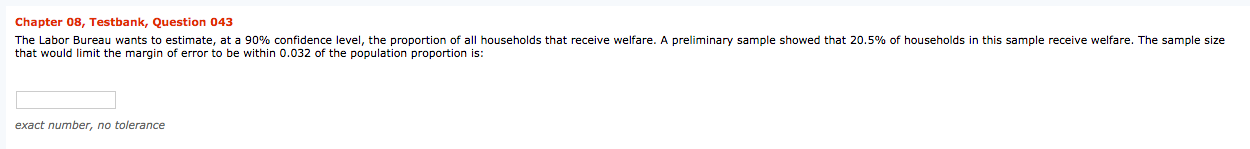
Transcribed Image Text:Chapter 08, Testbank, Question 043
The Labor Bureau wants to estimate, at a 90% confidence level, the proportion of all households that receive welfare. A preliminary sample showed that 20.5% of households in this sample receive welfare. The sample size
that would limit the margin of error to be within 0.032 of the population proportion is:
exact number, no tolerance
Expert Solution
This question has been solved!
Explore an expertly crafted, step-by-step solution for a thorough understanding of key concepts.

This is a popular solution

Trending nowThis is a popular solution!

Step by stepSolved in 2 steps with 3 images

Knowledge Booster

Similar questions
- Sample Size: Calculate the sample size. Karen from Big Chip cookie company discovered that on average her cookies have 12.9 chocolate chips with a standard deviation of 3.4 chocolate chips. If she wants to reduce the error for a 99% confidence interval to 1 chocolate chip, how many cookies should she sample?arrow_forwardThe current speed limit is 60 mph. This sample of speeds was taken at 4pm on a Monday. Use the data to construct a 80% confidence interval estimate of the standard deviation for the population speeds. 60 62 62 65 56 62 54 61 60 61 69 58 66 what is the lower limit what is the upper limitarrow_forwardI only need part Barrow_forward
- If you want to construct a 90% confident interval for a population mean such that it is within a quarter (population) standard deviation from the sample mean, then what is the minimum sample size required?arrow_forwardSuppose that you wanted to determine a confidence interval for the number of people who will get the influenza vaccine. You construct a 95% confidence interval and find a point estimate of 128,228 and a margin of error of 5400. a. What are the requirements necessary for finding this confidence interval. Assume that we do NOT know the standard deviation for the population.b. What interval would you construct (z-interval, t-interval or proportion interval)? Assume you do NOT know the population standard deviation.c. Construct the confidence interval.arrow_forwardA New York Times poll asked 1,850 adults in the United States a series of questions to find out their view on the U.S. economy. The 1,850 adults make up: the population the statistical inference the secondary data source the primary data source the sample 2. A sample of workers who completed training were asked to rate the training according to the following classification: outstanding, very good, fair, or poor. The level of measurement used is: nominal ordinal comprehensive interval ratio 3. The following frequency distribution displays the weekly sales of a certain brand of television at an electronics store. Number Sold Frequency 1-5 3 6-10 7 11-15 14 16-20 22 21-25 4 What is the width of each class in this distribution? 1 2 5 10 25arrow_forward
- Which type of confidence interval should you use in this situation? A sample of 25 different payroll departments found that the employees worked an average of 310.3 days a year with a standard deviation of 23.8 days. The distribution is approximately normally distributed. Find the 90% confidence interval for the average days worked of all payroll departments. Question 2 options: 1) a confidence interval for the mean using a table value from the standard normal distribution. 2) a confidence interval for the mean using a table value from the t distribution. 3) a confidence interval for a proportion using a table value from the standard normal distribution. 4) a confidence interval for proportion using a table value from the t distribution. 5) none of the above.arrow_forward9 The standard error of the mean is, a 0.881 b 0.735 c 0.612 d 0.510arrow_forwardFind 90% confidence intervalarrow_forward
- Determine whether the following statements are True or False: If we increase the confidence level C, then the width of the CI decreases, i.e., the CI becomes narrower. (Hint: think about what happens to the margin of error m) Suppose the mean of a population µ = 100. If we found that the margin of error is m = 2 for level of confidence 98%, then we can be 98% confident that a sample mean (computed from a sample of the same size used to compute m) is in the interval (98, 102).arrow_forwardResearchers studied the mean egg length (in millimeters) for a bird population. After taking a random sample of eggs, they obtained a 95% confidence interval of (45,60). What is the value of the margin of error? Choose the correct answer below. A. 15 mm B. 52.5 mm O c. 7.5 mm O D. 1.96arrow_forward
arrow_back_ios
arrow_forward_ios
Recommended textbooks for you
- MATLAB: An Introduction with ApplicationsStatisticsISBN:9781119256830Author:Amos GilatPublisher:John Wiley & Sons Inc
 Probability and Statistics for Engineering and th...StatisticsISBN:9781305251809Author:Jay L. DevorePublisher:Cengage Learning
 Statistics for The Behavioral Sciences (MindTap C...StatisticsISBN:9781305504912Author:Frederick J Gravetter, Larry B. WallnauPublisher:Cengage Learning
  Elementary Statistics: Picturing the World (7th E...StatisticsISBN:9780134683416Author:Ron Larson, Betsy FarberPublisher:PEARSON
 The Basic Practice of StatisticsStatisticsISBN:9781319042578Author:David S. Moore, William I. Notz, Michael A. FlignerPublisher:W. H. Freeman
 Introduction to the Practice of StatisticsStatisticsISBN:9781319013387Author:David S. Moore, George P. McCabe, Bruce A. CraigPublisher:W. H. Freeman
MATLAB: An Introduction with Applications
Statistics
ISBN:9781119256830
Author:Amos Gilat
Publisher:John Wiley & Sons Inc
Probability and Statistics for Engineering and th...
Statistics
ISBN:9781305251809
Author:Jay L. Devore
Publisher:Cengage Learning
Statistics for The Behavioral Sciences (MindTap C...
Statistics
ISBN:9781305504912
Author:Frederick J Gravetter, Larry B. Wallnau
Publisher:Cengage Learning
Elementary Statistics: Picturing the World (7th E...
Statistics
ISBN:9780134683416
Author:Ron Larson, Betsy Farber
Publisher:PEARSON
The Basic Practice of Statistics
Statistics
ISBN:9781319042578
Author:David S. Moore, William I. Notz, Michael A. Fligner
Publisher:W. H. Freeman
Introduction to the Practice of Statistics
Statistics
ISBN:9781319013387
Author:David S. Moore, George P. McCabe, Bruce A. Craig
Publisher:W. H. Freeman