MATLAB: An Introduction with Applications
6th Edition
ISBN: 9781119256830
Author: Amos Gilat
Publisher: John Wiley & Sons Inc
expand_more
expand_more
format_list_bulleted
Question
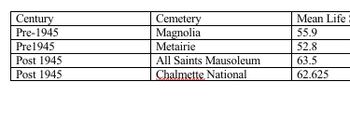
Make an excel bar graph for the information provided.

Transcribed Image Text:Century
Pre-1945
Pre 1945
Post 1945
Post 1945
Cemetery
Magnolia
Metairie
All Saints Mausoleum
Chalmette National
Mean Life
55.9
52.8
63.5
62.625
Expert Solution
arrow_forward
Step 1
To create bar graph in excel, we enter the data in Excel sheet.
Now go to Insert>Charts>Column>select data>ok.
Then we can see the bar graph for the above data set.
Step by stepSolved in 4 steps with 3 images

Knowledge Booster
Similar questions
- The basketball coach at a local college believes that his team scores more points at home games when more people show up. Below is a list of all home games last year with scores and corresponding attendance. Use Excel, SPSS, or work by hand to show your work finding r. Show your work on the attached pages. Score Attendance Score Attendance 54 380 67 410 57 350 78 215 59 320 67 113 80 478 56 250 82 451 85 450 75 250 101 489 73 489 99 472 53 451 What is the obtained t-score for this correlation? What is the critical t-score for a two-tailed test with a = 0.05? Is this correlation significant based on the t-scores?arrow_forwardWith the given information, construct a frequency bar graph.arrow_forwardPls help ASAParrow_forward
- The owner of a radio station wants to determine how much airtime songs take up. The owner collects the song length in seconds of 10 popular songs. The data are reproduced in the table below. Calculate the mode(s) using a TI-83. TI-83 plus, or TI-84 graphing calculator. Length of Songs in Seconds 279 219 298 134 206 293 165 227 230 212arrow_forwardA survey asked students what mode of transportation they normally use to get to school. The results are as follows: Bike 7, walk 29, bus 32, car 17. Represent this data in a circle graph.arrow_forwardPlease produce descriptive statistics for this data setarrow_forward
- A pediatrician records the age x (in yr) and average height y (in inches) for girls between the ages of 2 and 10. Height of Girls vs. Age 50- 40- (4,38) 30- 10- 0 Age(yr) Part: 0 / 4 Part 1 of 4 (a) Use the points (4, 38) and (8, 50) to write a linear model for these data. X y = Skip Part Check Height (in.) (8,50) Ⓒ2022 McGraw Hill LLC. All Rights Reserve Aarrow_forwardGraph the data in a scatter diagram: Age Calories 765 1520 15 2540 500 5. 795 17 2350 6. 1900 Use the paperclip button below to attach files. XDG BIUに ..arrow_forwardUse the given minimum and maximum data entries, and the number of classes, to find the class width, the lower class limits, and the upper class limits. minimum=9, maximum=53, 7 classes. What is the class width?arrow_forward
arrow_back_ios
arrow_forward_ios
Recommended textbooks for you
 MATLAB: An Introduction with ApplicationsStatisticsISBN:9781119256830Author:Amos GilatPublisher:John Wiley & Sons Inc
 Probability and Statistics for Engineering and th...StatisticsISBN:9781305251809Author:Jay L. DevorePublisher:Cengage Learning
 Statistics for The Behavioral Sciences (MindTap C...StatisticsISBN:9781305504912Author:Frederick J Gravetter, Larry B. WallnauPublisher:Cengage Learning
 Elementary Statistics: Picturing the World (7th E...StatisticsISBN:9780134683416Author:Ron Larson, Betsy FarberPublisher:PEARSON
 The Basic Practice of StatisticsStatisticsISBN:9781319042578Author:David S. Moore, William I. Notz, Michael A. FlignerPublisher:W. H. Freeman
 Introduction to the Practice of StatisticsStatisticsISBN:9781319013387Author:David S. Moore, George P. McCabe, Bruce A. CraigPublisher:W. H. Freeman

MATLAB: An Introduction with Applications
Statistics
ISBN:9781119256830
Author:Amos Gilat
Publisher:John Wiley & Sons Inc

Probability and Statistics for Engineering and th...
Statistics
ISBN:9781305251809
Author:Jay L. Devore
Publisher:Cengage Learning

Statistics for The Behavioral Sciences (MindTap C...
Statistics
ISBN:9781305504912
Author:Frederick J Gravetter, Larry B. Wallnau
Publisher:Cengage Learning

Elementary Statistics: Picturing the World (7th E...
Statistics
ISBN:9780134683416
Author:Ron Larson, Betsy Farber
Publisher:PEARSON

The Basic Practice of Statistics
Statistics
ISBN:9781319042578
Author:David S. Moore, William I. Notz, Michael A. Fligner
Publisher:W. H. Freeman

Introduction to the Practice of Statistics
Statistics
ISBN:9781319013387
Author:David S. Moore, George P. McCabe, Bruce A. Craig
Publisher:W. H. Freeman