MATLAB: An Introduction with Applications
6th Edition
ISBN: 9781119256830
Author: Amos Gilat
Publisher: John Wiley & Sons Inc
expand_more
expand_more
format_list_bulleted
Question

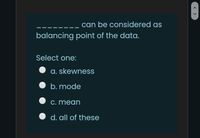
Transcribed Image Text:can be considered as
balancing point of the data.
Select one:
a. skewness
b. mode
C. mean
d. all of these
< >
Expert Solution
This question has been solved!
Explore an expertly crafted, step-by-step solution for a thorough understanding of key concepts.
This is a popular solution
Trending nowThis is a popular solution!
Step by stepSolved in 2 steps with 2 images

Knowledge Booster
Similar questions
- Ghughuarrow_forwardGiven the following set of data, determine the mode.arrow_forwardDIRECTIONS: enter the correct phrase, without the quotes, in each blank. Enter either "greater than" or "less than" in the first blank. Enter either "not be" or "be" in the second blank, and enter either "increasing" or "decreasing" in the third blank. A set of 15 data values has a mean of 80 and a standard devaiton of six. Two more value are added to the data set so there are now 17 data values. If the two values added are 60 and 100, the new standard deviation of all 17 values will be six because the values of 60 and 100 would A/ A/ extreme values, thus A the spread of the dataarrow_forward
- It is a branch of statistics that deals with data analysis and one of itstechnique is to “describe” data in symbolic form and abbreviated fashion.a. Inferential Statistics c. Descriptive Statisticsb. Statistics and Probability d. Probabilityarrow_forwardGraph a Histogram based on the data. How many sports have you played? Male vs Female 0 Sports: Male= 0, Female=21 Sport: Male= 5, Female=32 Sports: Male= 3, Female=103 Sports: Male= 5, Female=34 Sports: Male= 3, Female=25 Sports: Male= 4, Female=0arrow_forwardDo A/Barrow_forward
- Ethan and Drew went on a 10-day fishing trip. The number of smallmouth bass caught and released by the two boys each day is shown in the accompanying data table. Complete parts (a) through (d) below. Click the icon to view the data table. Data Table Ethan 8 24 9. 9. 9. 10 Drew 14 2 4 17 20 17 19 3arrow_forwardIn Exercises 33 to 36, determine whether or not the conditions for using two-sample t procedures are met. 33. Shoes How many pairs of shoes do teenagers have? To find out, a group of AP® Statistics students conducted a survey. They selected a random sample of 20 female students and a separate random sample Females 333 95 4332 66 410 8 9 100 7 0 0 4455 WW~~ 1 1 2 2 2 Males 4 3 555677778 0000124 3 58 Key: 22 represents a male student with 22 pairs of shoes.arrow_forwardDetermine whether the data described below are qualitative or quantitative and explain why. The heights of subjects in a clinical trial of a new drug Choose the correct answer below. A. The data are quantitative because they consist of counts or measurements. O B. The data are qualitative because they consist of counts or measurements. O C. The data are qualitative because they don't measure or count anything. O D. The data are quantitative because they don't measure or count anything.arrow_forward
- Mai collects information about 37 classmates. She believes her data set is perfectly symmetrical with a mean and median of 20. She then realizes that the number she has recorded as 32 was actually supposed to be 42. What is true about the mean and median of her corrected data set? A: The mean and median of the corrected set are both still 20. B: The mean of the corrected data set is still 20, but the median is greater than 20. C: The median of the corrected data set is still 20, but the mean is greater than 20. D: The mean and median of the corrected set are both greater than 20.arrow_forwardAnswer 3 and 4 onlyarrow_forwardJoselyn hopes to receive a grade of B or better in her statistics class. Currently she has scored 75, 83, and 81 on her three in-class tests and also has a homework average of 88. Her professor calculates the class grade by finding the mean of five grades: three in-class tests, the homework average and the final exam. What is the minimum score Joselyn must earn on the final exam to have a class grade (mean) of 80? A. 67 B. 95 C. 70 D. 73arrow_forward
arrow_back_ios
SEE MORE QUESTIONS
arrow_forward_ios
Recommended textbooks for you
 MATLAB: An Introduction with ApplicationsStatisticsISBN:9781119256830Author:Amos GilatPublisher:John Wiley & Sons Inc
 Probability and Statistics for Engineering and th...StatisticsISBN:9781305251809Author:Jay L. DevorePublisher:Cengage Learning
 Statistics for The Behavioral Sciences (MindTap C...StatisticsISBN:9781305504912Author:Frederick J Gravetter, Larry B. WallnauPublisher:Cengage Learning
 Elementary Statistics: Picturing the World (7th E...StatisticsISBN:9780134683416Author:Ron Larson, Betsy FarberPublisher:PEARSON
 The Basic Practice of StatisticsStatisticsISBN:9781319042578Author:David S. Moore, William I. Notz, Michael A. FlignerPublisher:W. H. Freeman
 Introduction to the Practice of StatisticsStatisticsISBN:9781319013387Author:David S. Moore, George P. McCabe, Bruce A. CraigPublisher:W. H. Freeman

MATLAB: An Introduction with Applications
Statistics
ISBN:9781119256830
Author:Amos Gilat
Publisher:John Wiley & Sons Inc

Probability and Statistics for Engineering and th...
Statistics
ISBN:9781305251809
Author:Jay L. Devore
Publisher:Cengage Learning

Statistics for The Behavioral Sciences (MindTap C...
Statistics
ISBN:9781305504912
Author:Frederick J Gravetter, Larry B. Wallnau
Publisher:Cengage Learning

Elementary Statistics: Picturing the World (7th E...
Statistics
ISBN:9780134683416
Author:Ron Larson, Betsy Farber
Publisher:PEARSON

The Basic Practice of Statistics
Statistics
ISBN:9781319042578
Author:David S. Moore, William I. Notz, Michael A. Fligner
Publisher:W. H. Freeman

Introduction to the Practice of Statistics
Statistics
ISBN:9781319013387
Author:David S. Moore, George P. McCabe, Bruce A. Craig
Publisher:W. H. Freeman