
MATLAB: An Introduction with Applications
6th Edition
ISBN: 9781119256830
Author: Amos Gilat
Publisher: John Wiley & Sons Inc
expand_more
expand_more
format_list_bulleted
Related questions
Question
Solve please.
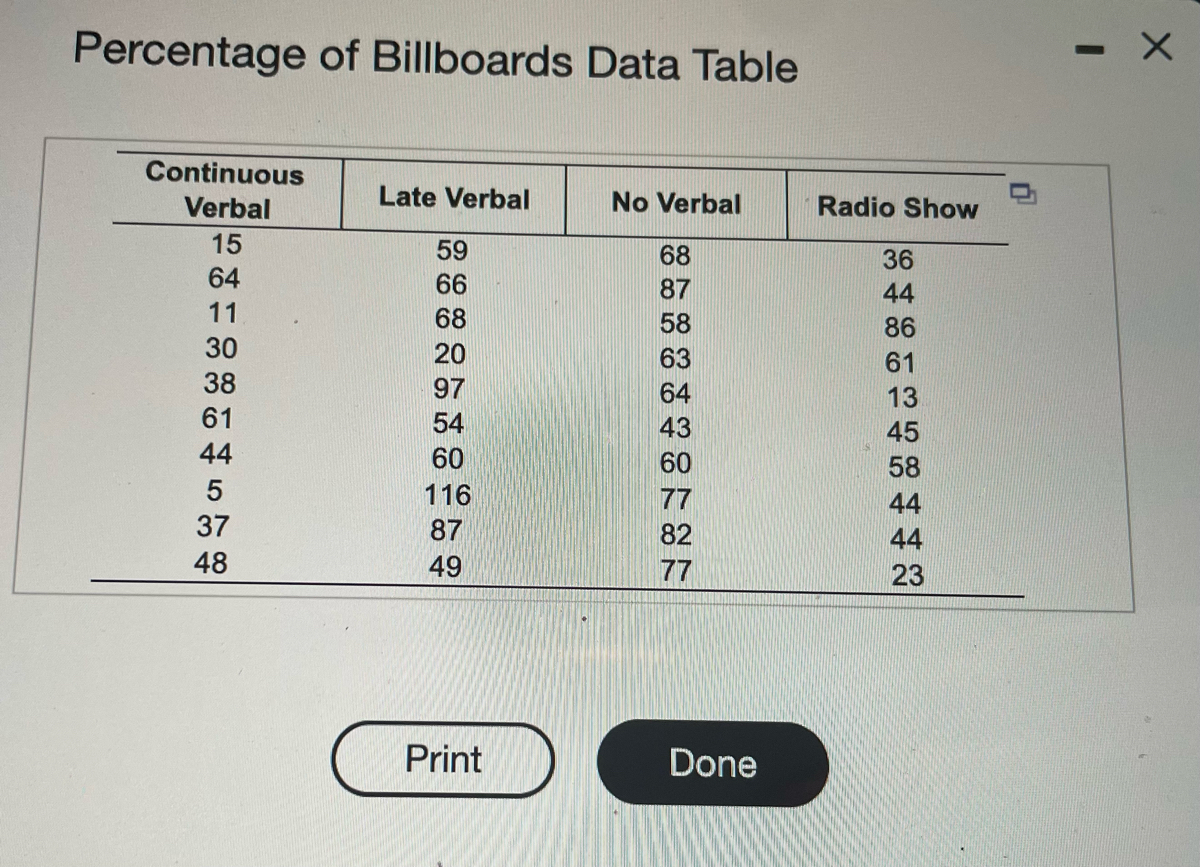

Transcribed Image Text:Percentage of Billboards Data Table
Continuous
Verbal
15
64
11
30
38
61
44
5
37
48
Late Verbal
59
66
68
20
97
54
60
116
87
49
Print
No Verbal
68
87
58
63
64
43
77
82
77
Done
Radio Show
36
44
86
61
13
45
58
44
44
23
-
X

Transcribed Image Text:Can a secondary task-such as a word association task-improve your performance when driving while fatigued? This was the question of interest in a study. The researchers used a driving
simulator to obtain their data. Each of 40 college students was assigned to drive a long distance in the simulator. However, the student-drivers were divided into four groups of 10 drivers each.
Group 1 performed the verbal task continuously (continuous verbal condition); Group 2 performed the task only at the end of the drive (late verbal condition); Group 3 did not perform the task at
all (no verbal condition); and Group 4 listened to a program on the car radio (radio show condition). At the end of the simulated drive, drivers were asked to recall billboards that they saw along the
way. The percentage of billboards recalled by each student-driver is provided in the accompanying table. Use the appropraite analysis to determine if the mean recall percentage differs
for student-drivers in the four groups. Test using a = 0.01.
Click here to view the data table.
What are the hypotheses?
OA. Ho: H₁ H₂ H3 H4
Ha: At least two treatment means are equal
O B. Ho: At least two treatment means are equal
Ha: H₁ H₂ H3 H4
OC. Ho: At least two treatment means differ
Ha: H1 H2 H3 H4
OD. Ho: H₁ H2 H3 H4
Ha: At least two treatment means differ
Identify the testystatistic.
F= (Round to three decimal places as needed.)
Identify the p-value.
p-value =
(Round to three decimal places as needed.)
Expert Solution
This question has been solved!
Explore an expertly crafted, step-by-step solution for a thorough understanding of key concepts.

Step by stepSolved in 3 steps with 8 images

Knowledge Booster

Similar questions
arrow_back_ios
SEE MORE QUESTIONS
arrow_forward_ios
Recommended textbooks for you
- MATLAB: An Introduction with ApplicationsStatisticsISBN:9781119256830Author:Amos GilatPublisher:John Wiley & Sons Inc
 Probability and Statistics for Engineering and th...StatisticsISBN:9781305251809Author:Jay L. DevorePublisher:Cengage Learning
 Statistics for The Behavioral Sciences (MindTap C...StatisticsISBN:9781305504912Author:Frederick J Gravetter, Larry B. WallnauPublisher:Cengage Learning
  Elementary Statistics: Picturing the World (7th E...StatisticsISBN:9780134683416Author:Ron Larson, Betsy FarberPublisher:PEARSON
 The Basic Practice of StatisticsStatisticsISBN:9781319042578Author:David S. Moore, William I. Notz, Michael A. FlignerPublisher:W. H. Freeman
 Introduction to the Practice of StatisticsStatisticsISBN:9781319013387Author:David S. Moore, George P. McCabe, Bruce A. CraigPublisher:W. H. Freeman
MATLAB: An Introduction with Applications
Statistics
ISBN:9781119256830
Author:Amos Gilat
Publisher:John Wiley & Sons Inc
Probability and Statistics for Engineering and th...
Statistics
ISBN:9781305251809
Author:Jay L. Devore
Publisher:Cengage Learning
Statistics for The Behavioral Sciences (MindTap C...
Statistics
ISBN:9781305504912
Author:Frederick J Gravetter, Larry B. Wallnau
Publisher:Cengage Learning
Elementary Statistics: Picturing the World (7th E...
Statistics
ISBN:9780134683416
Author:Ron Larson, Betsy Farber
Publisher:PEARSON
The Basic Practice of Statistics
Statistics
ISBN:9781319042578
Author:David S. Moore, William I. Notz, Michael A. Fligner
Publisher:W. H. Freeman
Introduction to the Practice of Statistics
Statistics
ISBN:9781319013387
Author:David S. Moore, George P. McCabe, Bruce A. Craig
Publisher:W. H. Freeman