Calculus: Early Transcendentals
8th Edition
ISBN: 9781285741550
Author: James Stewart
Publisher: Cengage Learning
expand_more
expand_more
format_list_bulleted
Question
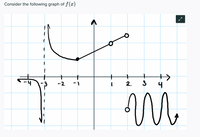
What is the domian of f'(x)?

Transcribed Image Text:**Title: Understanding the Graph of Function \( f(x) \)**
**Graph Explanation:**
The image presents the graph of a function \( f(x) \) with distinct characteristics across different intervals on the x-axis. Below is a detailed explanation of the graph’s components:
1. **Discontinuity at x = -3:**
- There is a vertical dashed line at \( x = -3 \), indicating a vertical asymptote.
- As \( x \) approaches -3 from the left, \( f(x) \) sharply decreases towards negative infinity.
2. **Curve and Behavior from x = -3 to x = 1:**
- Between \( x = -3 \) and \( x = 1 \), the function appears to be a decreasing curve that transitions into a linear segment.
- There is a filled dot at approximately \( (-1, 0) \), indicating that the point is included in the graph.
3. **Linear Segment from x = 1 to x = 2:**
- The graph includes an open circle at \( x = 1 \) and \( x = 2 \). This signifies that these points are not part of the graph, indicating possible discontinuities or endpoints.
4. **Oscillating Behavior Beyond x = 2:**
- Beyond \( x = 2 \), the graph demonstrates an oscillating pattern, suggesting periodic behavior.
- The oscillation includes an open circle, indicating a gap or undefined point in the function.
Overall, this graph showcases different behaviors including discontinuities, linear sections, and oscillations as \( x \) ranges from negative to positive values. Understanding these elements can greatly contribute to comprehending the characteristics of function \( f(x) \).
Expert Solution
arrow_forward
Basic

Step by stepSolved in 2 steps with 2 images

Knowledge Booster
Similar questions
arrow_back_ios
arrow_forward_ios
Recommended textbooks for you
 Calculus: Early TranscendentalsCalculusISBN:9781285741550Author:James StewartPublisher:Cengage Learning
 Thomas' Calculus (14th Edition)CalculusISBN:9780134438986Author:Joel R. Hass, Christopher E. Heil, Maurice D. WeirPublisher:PEARSON
 Calculus: Early Transcendentals (3rd Edition)CalculusISBN:9780134763644Author:William L. Briggs, Lyle Cochran, Bernard Gillett, Eric SchulzPublisher:PEARSON
 Calculus: Early TranscendentalsCalculusISBN:9781319050740Author:Jon Rogawski, Colin Adams, Robert FranzosaPublisher:W. H. Freeman
 Calculus: Early Transcendental FunctionsCalculusISBN:9781337552516Author:Ron Larson, Bruce H. EdwardsPublisher:Cengage Learning

Calculus: Early Transcendentals
Calculus
ISBN:9781285741550
Author:James Stewart
Publisher:Cengage Learning

Thomas' Calculus (14th Edition)
Calculus
ISBN:9780134438986
Author:Joel R. Hass, Christopher E. Heil, Maurice D. Weir
Publisher:PEARSON

Calculus: Early Transcendentals (3rd Edition)
Calculus
ISBN:9780134763644
Author:William L. Briggs, Lyle Cochran, Bernard Gillett, Eric Schulz
Publisher:PEARSON

Calculus: Early Transcendentals
Calculus
ISBN:9781319050740
Author:Jon Rogawski, Colin Adams, Robert Franzosa
Publisher:W. H. Freeman


Calculus: Early Transcendental Functions
Calculus
ISBN:9781337552516
Author:Ron Larson, Bruce H. Edwards
Publisher:Cengage Learning