
MATLAB: An Introduction with Applications
6th Edition
ISBN: 9781119256830
Author: Amos Gilat
Publisher: John Wiley & Sons Inc
expand_more
expand_more
format_list_bulleted
Related questions
Question
Calculating the
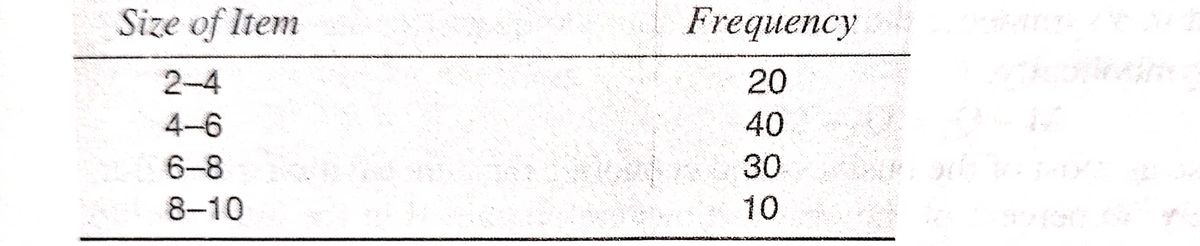

Transcribed Image Text:Size of Item
2-4
4-6
6-8
28-10
Frequency
20
40
30
ob
14
Expert Solution
This question has been solved!
Explore an expertly crafted, step-by-step solution for a thorough understanding of key concepts.

Step by stepSolved in 2 steps with 2 images

Knowledge Booster

Similar questions
- Home prices in a city have mean = $194,000 and standard deviation = $20,000. For n = 25 randomly selected homes, the mean price is x = $198,000. Find the value of the standardized statistic (z- score) for this sample mean. z = USE SALTarrow_forwardThe standard deviation of the distribution of sample means is also known as the: O standard error of measurement standard error of the population population standard deviation variance of the error meanarrow_forwardIn an advertising campaign, a snack company claimed that every 18-ounce bag of its cookies contained at least 1000 chocolate chips. Two statisticians attempted to verify the claim. The accompanying data represent the number of chips in an 18-ounce bag of the company's cookies based on their study. Complete parts (a) through (e). Click here to view the chocolate chip data table. Click here to view the standard normal distribution table (page 1). Click here to view the standard normal distribution table (page 2). Chocolate Chip Data Table 1216 1216 1218 1267 1274 1278 1289 1290 1298 1310 1327 1092 1094 1151 1348 1169 1356 1106 1181 1358 1124 1127 1135 1136 1143 1190 1231 1378 1195 1205 1210 1215 1241 1243 1246 1253 1402 1415 1440 1516 Print Donearrow_forward
- How do I use Excel to calculate the SAMPLE STD DEVIATION of a column?arrow_forwardUse Chebyshevs rule and the empirical rule to describe the distribution of this data set. Count the actual number of observations that fall within one, two, and three standard deviations of the mean if the data set and compare these counts with the description of the the data set I developed.arrow_forwardCalculate the observed z value using a sample mean of 25, a population average of 20, and a standard error of the mean of 8.arrow_forward
- What is the normalized z-score for a data point that has a value of 50 if the mean (Mu) is 560 and sigma is 55? This data point is taken from a total of 800 data point values .arrow_forwardThe F-statistic is a ratio score resulting in a measure of the estimated proportion of variance due to the independent variable. True or falsearrow_forwardIt is only appropriate and possible to calculate the variance and standard deviation as measures of variability for variables measured using a(n) _____ scale of measurement.arrow_forward
- The distance of a single score from the mean - for example, the distance of your exam score from the average exam score for the entire class - is referred to as what? O Deviation O Variance Sum of Squared deviations (S.S.) Standard deviationarrow_forwardP3. Show that the mle of unknown standard deviation when the mean is known is different from the sample standard deviation when the random sample is taken from a normal population characterized by two parameters, mean and variance. Which estimator is unbiased? Justify your answer. Show that a sample mean is a minimum variance unbiased estimator of the mean of a normal population with known variance.arrow_forward
arrow_back_ios
arrow_forward_ios
Recommended textbooks for you
- MATLAB: An Introduction with ApplicationsStatisticsISBN:9781119256830Author:Amos GilatPublisher:John Wiley & Sons Inc
 Probability and Statistics for Engineering and th...StatisticsISBN:9781305251809Author:Jay L. DevorePublisher:Cengage Learning
 Statistics for The Behavioral Sciences (MindTap C...StatisticsISBN:9781305504912Author:Frederick J Gravetter, Larry B. WallnauPublisher:Cengage Learning
  Elementary Statistics: Picturing the World (7th E...StatisticsISBN:9780134683416Author:Ron Larson, Betsy FarberPublisher:PEARSON
 The Basic Practice of StatisticsStatisticsISBN:9781319042578Author:David S. Moore, William I. Notz, Michael A. FlignerPublisher:W. H. Freeman
 Introduction to the Practice of StatisticsStatisticsISBN:9781319013387Author:David S. Moore, George P. McCabe, Bruce A. CraigPublisher:W. H. Freeman
MATLAB: An Introduction with Applications
Statistics
ISBN:9781119256830
Author:Amos Gilat
Publisher:John Wiley & Sons Inc
Probability and Statistics for Engineering and th...
Statistics
ISBN:9781305251809
Author:Jay L. Devore
Publisher:Cengage Learning
Statistics for The Behavioral Sciences (MindTap C...
Statistics
ISBN:9781305504912
Author:Frederick J Gravetter, Larry B. Wallnau
Publisher:Cengage Learning
Elementary Statistics: Picturing the World (7th E...
Statistics
ISBN:9780134683416
Author:Ron Larson, Betsy Farber
Publisher:PEARSON
The Basic Practice of Statistics
Statistics
ISBN:9781319042578
Author:David S. Moore, William I. Notz, Michael A. Fligner
Publisher:W. H. Freeman
Introduction to the Practice of Statistics
Statistics
ISBN:9781319013387
Author:David S. Moore, George P. McCabe, Bruce A. Craig
Publisher:W. H. Freeman