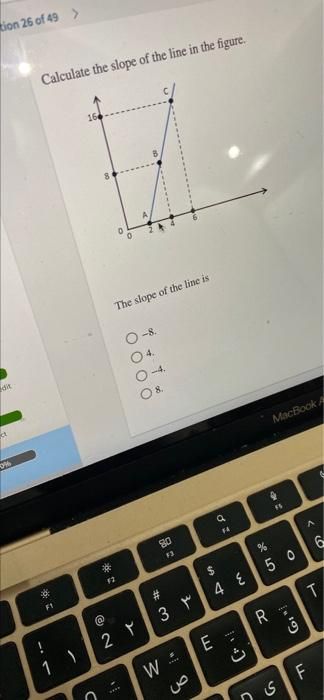
Q: In the accompanying graph, is the slope of curve AA' positive or negative? Does the slope increase…
A: Disclaimer- “Since you have asked multiple question, we will solve the first three question for you…
Q: An index number that measures a basket of related items is called?
A: The Consumer Price Index (CPI) is a computation of the average change over time in the prices paid…
Q: Briefly explain what are flow variables?
A: In economics, a distinction is often made between quantities that are stocks and quantities that are…
Q: You are given the function y=11−1.5x. The slope of the equation is enter your response here.…
A:
Q: What do the dots in this scatter diagram show? The dots in this scatter diagram show that as the…
A: A scatter diagram, also known as a scatter plot or scatter graph, is a graphical representation of…
Q: Year x V 2000 62 143 2001 5.7 156 2002 5.3 162 The data in Table 1A.2.1 shows that Select one: a.…
A: Negative relationship: When one variable decreases and another variable increases the two variables…
Q: 24 PRICE (Dollars per box) 21 18 15 12 0 24 30 36 42 48 QUANTITY (Thousands of boxes) 6 12 18 54 60
A: An individual’s willingness to pay for each unit of the quantity he or she wishes to consume is…
Q: Can I see a graph for 1. (b) to illustrate the price of coffee beans increasing
A: The demand curve shows an inverse relationship between price and quantity demanded. The supply curve…
Q: In a straight line, the value of the slope differs in different points in the line. True False
A: The slope shows the steepness and direction of the line. It measures where the line is tilted, flat…
Q: How are the slopes of the IS and LM curves determined? Explain with graph
A: IS curve refers to the goods market equilibrium curve which is explained by the Keynesian model. The…
Q: The accompanying graph shows curve XX' and tangents at points A, B, and C. Calculate the slope of…
A: A curve's slope is determined by measuring the difference between two locations on the curve between…
Q: Class Exercise No 1 • Given the following data in the table:- 1- Draw the curve where Y is vertical…
A: Given: Points Y…
Q: In a curved line, the value of the slope differs along the curve. True O False
A: Economics as a subject deals with the allocation of scarce resources among humans with unlimited…
Q: QUESTION: What is the median of these numbers? (Please round your answer to 2 decimal places, ex:…
A: To find the median of a set of numbers, you need to first arrange the numbers in order from lowest…
Q: The slope of IC2 from A to B is: Good X 10 IC 8 ICz 10 12 Good Y 00
A: Indifference curve shows different combinations of two goods that give same level of utility.
Q: Calculate business investment for the following data: Y = 55,000 C = 40,000 G= 5,000 NX= - 2000…
A: Aggregate expenditure is the sum of consumption, investment, government spending, and net exports.…
Q: A restaurant has tracked the number of meals served at lunch over the last four weeks. The data show…
A: To determine the seasonal (daily) indices for the restaurant based on the number of meals served at…
Q: For the relationship graphed below: Household Spending = C ($/month) a Question 7 Homework…
A: Macroeconomics refers to the branch of economics dealing with the performance, structure, behavior,…
Q: Inicially a slice of pizza coses S9, and a change in the market makes the price of a slice of pizza…
A: The measure of the responsiveness of the quantity (Q) demanded of one good to a change in the price…
Q: Plot the following dataset and elaborate your concept regarding the graph: Quantity AC MC 0 110 -…
A: We have given the cost structure of a firm.
Q: Is this a good variable definition? YES OR NO ? IF NO than explain why?
A: Answer 1) Yes this is a good variable definition Reason: Since Colton likes to know the time when…
Q: The variable shown on the vertical axis is _________ . The units for the variable on the…
A: Figure illustrates the relationship between the two variables. This figure shows the relationship…
Q: Can the IS curve shift in (Y,i) coordinates? What coordinates is it drawn in?
A: The IS curve represents the goods market equilibrium. At all points on this curve, desired…
Q: Figure 1.1 negative The line segment CB indicates a relationship between the X and Y variables.
A: In economics, the concept of variables can be described as measurable quantities or characteristics…
Q: Do averages show the real picture of data
A: Answer: The averages are simply an outcome of the sum of numbers divided by the number of units or…
Q: a. At an income of 4000, how much is consumed? How much is saved? O Consumption = $ -500 Savings =…
A: The national income is the summation of a country's final goods and services. It is a yardstick…
Q: *) Construct a time series line graph of the stock prices for each of the following companies,…
A:
Q: What is the mean of these numbers? (Please round your answer to 2 decimal places, ex: 3.21)…
A: Mean is the average of the values given. Mean is calculated as the sum of observation Divided by…
Q: Mark Gershon, owner of a musical instrument distributorship, thinks that demand for guitars may be…
A: The demand is defined as the desire of an individual to buy a product. The individual has the…
Q: Calculate MPS The value of MPC is 0.62
A: In the question the value of Marginal propensity to consume is given to be as 0.62 We have to…
Q: Refer to the figure below. According to this graph, the relationship between hours of study time and…
A: When two variables are positively/directly related it means that when one variable's value rises,…
Q: interpret the data in the graph
A: The above graph shows the transactions amount of customers and income of bank customers.
Q: The blue curve on the following graph shows the height of an airplane over 10 minutes of flight. The…
A: The formula for calculating slope is, Slope = Change in Y / Change in X
Q: The quadrant on which IS and LM are plotted is known as IY space? true or false
A: IS line shows the goods market equilibrium and it is downward sloping curve which shows Inverse…
Q: A zero slope shows: positive relationship between two variables no relationship between two…
A: The slope reflects the relationship between two variables that can be graphically represented as…
Q: Use the item weights in the figure to determine the percentage change in the CPI that would result…
A: The cost difference between purchasing a bundle of goods and the base year is measured by the…
Q: Mark Gershon, owner of a musical instrument distributorship, thinks that demand for guitars may be…
A: The graph depicts the association between the amount of Maroon 5 TV appearances and guitar demand…
Q: Can you do a IS and LM both shifting to the left a graph
A: The IS-LM model is a macroeconomic model that shows the relationship between interest rates and…
Q: 4. A decision at the margin Suppose that Bella is a diligent first-year college student. One Sunday,…
A:
Q: 2.5 2.0 1.5 1.0 0.5 1970 1980 1990 2000 Year Topic: Time-Series Graphs Skill: Analytical 10) In the…
A: The graph that represents the sequence of points of data that tend to occur in an order being…
Q: Compute the MUx, MUy, AUx and AUy. Compute the MUx, MUy, AUx and AUy. Given:…
A: MUx= TUn-TUn-1MUy=TUn-TUn-1AUx= TUxQAUy=TUyQ
Q: 1. Find the derivatives of the following: a. y = 8x3 b. у%3-12 c. f(x) = -6x5 d. y = 5x-2 e. y =…
A: Answer;
Q: a) direct relationship. b) inverse relationship. c) converse relationship d) negative…
A: Answer: Direct relationship: A direct relationship between two variables occurs when due to an…
Q: The graph illustrates the relationship between two variables, x and y. 15.0 13.5- 12.0 10.5- 9.0-…
A: The slope of the curve shows the ratio between the change of two variables (here x and y). As we can…
Q: Calculate the consumption of goods and services in your family in the following a. Groceries like…
A: Consumption in economics is the total value of goods and services consumed by an consumer.…
Q: Recall the fact that 1 feet = 12 inches. Conversion factors are fractions of value 1 that we use to…
A: 516=316=5.17As,1 feet=12 incches5.17 feet=(5.167 x 12) inches =62.004 or 62 incches
Q: Suppose you have been hired as a management consultant by a major optimally price gasoline at its…
A: Gross domestic product is the final combination of goods and services at a country's border. GDP is…
Step by step
Solved in 2 steps
- In economics, what does the term ceteris paribus mean when analyzing the relationship between two variables? A. All other things being equal or held constant B. The direct relationship between two variables C. The inverse relationship between two variables D. The absence of any relationship between two variablesBriefly describe the concept of VIF (what is it, why do we use it) and explain how to calculate VIF in a model with 3 independent variables.The world's population living in extreme poverty has declined linearly between the years 2005 and 2011. In 2005, the percentage of the world's population living in extreme poverty was 20.70% and in 2011, the percentage of the world's population living in extreme poverty was 13.70%. Determine a linear equation that models the world's population in extreme poverty, in percentage, as a function of years since 2005. What is the slope of this function, and what does it tell you in practical terms? Round your answer to the nearest hundredth (0.01). Om = -7.00. The world's population in extreme poverty decreased by 7 percent per year between the years 2005 and 2011. Om = 7.00. The world's population in extreme poverty increased by 7 percent per year between the years 2005 and 2011. Om = 1.17. The world's population in extreme poverty increased by 1.17 percent per year between the years 2005 and 2011. Om = -1.17. The world's population in extreme poverty decreased by 1.17 percent per year…
- Consider the data points in the table below Y. 80.0 60.0 1.0 2.0 3.0 400 200 00 4.0 Graphing these points results in line that passes through the point (3.0, (Round your response to one decimal place) 5435The slope of the graph y=x^2-3x+7 at the point (1,5) is . . . a. -1 b. -2 c. 5 d. 11The mathematical slope of the steeper line is _____ the slope of the less-steep line.
- The graph says: Clothing (units per 16 week) 14 12 10 1 2 3 4 5 Food (units per week) You are willing to give up 6 units of clothing to get the first unit of food You are willing to give up 4 units of clothing to get the third unit of food You are willing to give up 1 unit of clothing to get the fourth unit of food You are willing to give up 2 unit of clothing to get the fifth unit of food You are willing to give up 6 units of clothing to get the third unit of foodWhich one of the following is not true about slope? A, It is vertical change over horizontal change B, The slope of a line represents the change in one variable that occurs when the other variable changes C, The slope of straight line between any two point on the line is negative D Slope= y2-y1/x2-x1Solution sent e only typing work
- From the following data relating to the number of letters posted a Post office find the seasonal variations within the 5 weeks by using the method of simple averages Days Weeks Sun. Mon. Tue. Wed. Thu. Fri. Sat. 1st 18 161 170 164 153 181 76 2nd 18 165 179 157 168 195 85 21 162 169 153 139 185 82 3rd 4th 5th 24 171 182 170 162 179 95 27 162 186 170 170 182 120In the equation S = 130 – 2T, where S is hot chocolate sales and T is temperature, sales _____ if temperature increases by 10 degrees. A. increase by 20 B. decrease by 20 C. increase by 2 D. decrease by 2The slope of IC, from A to F is: Good X 10 IC 8 IC 10 12 Good Y