
MATLAB: An Introduction with Applications
6th Edition
ISBN: 9781119256830
Author: Amos Gilat
Publisher: John Wiley & Sons Inc
expand_more
expand_more
format_list_bulleted
Related questions
Question
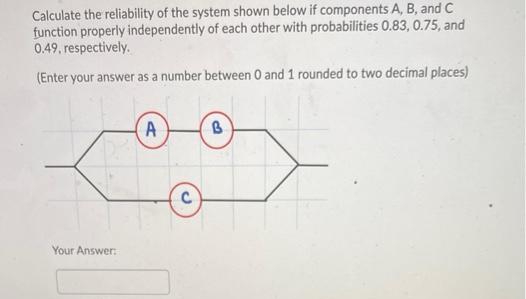

Transcribed Image Text:Calculate the reliability of the system shown below if components A, B, and C
function properly independently of each other with probabilities 0.83, 0.75, and
0.49, respectively.
(Enter your answer as a number between 0 and 1 rounded to two decimal places)
A
Your Answer:
Expert Solution
This question has been solved!
Explore an expertly crafted, step-by-step solution for a thorough understanding of key concepts.

This is a popular solution

Trending nowThis is a popular solution!

Step by stepSolved in 2 steps with 2 images

Knowledge Booster

Similar questions
- Professor Fair believes that extra time does not improve grades on exams. He randomly divided a group of 300 students into two groups and gave them all the same test. One group had exactly 1 hour in which to finish the test, and the other group could stay as long as desired. The results are shown in the following table. Test at the 0.01 level of significance that time to complete a test and test results are independent. Time A B C F Row Total 1 h 22 41 65 12 140 Unlimited 17 49 86 8 160 Column Total 39 90 151 20 300 (ii) Find the sample test statistic. (Round your answer to two decimal places.)arrow_forwardenter any one of three different lines that have formed at three teller windows. Answer the following questions. The values listed below are waiting times (in minutes of customers at two different banks. At Bank A, customers enter a single waiting line that feeds three teller windows. At Bank B, customers m Bank A 6.6 Bank B 6.7 4.2 5.8 6.8 5.4 6.2 7.1 6.6 7.2 7.8 7.5 7.8 8.5 Click the icon to view the table of Chi-Square critical values. 7.8 9.3 7.8 10.0 construct a 90% confidence interval for the population standard deviation at bank A. Construct a 90% confidence interval for the population standard deviation at bank B.arrow_forwardThe owner of a chain of mini-markets wants to compare the sales performance of two of her stores, Store 1 and Store 2. Sales can vary considerably depending on the day of the week and the season of the year, so she decides to eliminate such effects by making sure to record each store's sales on the same 12 days, chosen at random. She records the sales (in dollars) for each store on these days, as shown in the table below. 5 6 7 Day Store 1 Store 2 1 Difference (Store 1 - Store 2) Send data to calculator ✓ 2 3 786 878 827 645 708 500 699 140 Yes No 4 646 802 712 579 527 367 76 115 66 181 133 8 (a) State the null hypothesis H and the alternative hypothesis H₁. H:D H₁:0 (b) Determine the type of test statistic to use. Type of test statistic: (Choose one) ▼ 970 9 10 11 12 618 679 762 635 271 572 324 215 698 530 Based on these data, can the owner conclude, at the 0.05 level of significance, that the mean daily sales of the two stores differ? Answer this question by performing a hypothesis…arrow_forward
- Becky and Carla take an advanced yoga class. Becky can hold 29% of her poses for over a minute, while Carla can hold 35% of her poses for over a minute. Suppose each yoga student is asked to hold 50 poses. Let B the proportion of poses Becky can hold for over a minute and C = the proportion of poses Carla can hold for over a minute. What is the probability that Becky's proportion of poses held for over a minute is greater than Carla's? Find the z-table here. O 0.159 O 0,259 0 0.448 O 0,741 Save and Exit Next Submit Math and rem 96 & 7 8 9. 10arrow_forwardA system has five components connected as shown in the diagram. Assume A, B, C, D, and E function independently. If the probabilities that A, B, C, D, and E function 0.50, 0.65, 0.75, 0.95, and 0.80 respectively, what is the probability that the system fails?arrow_forwardNeed it asap pls.arrow_forward
- edo exercises 17 and 18 in section 8.1 of your textbook, about the small animal who lives in an area with woods and meadows, using the following data:If the animal is in the woods on one observation, then it is twice as likely to be in the woods as the meadows on the next observation. If the animal is in the meadows on one observation, then it is three times as likely to be in the meadows as the woods on the next observation.Assume that state 1 is being in the meadows and that state 2 is being in the woods.(1) Find the transition matrix for this Markov process. (2) If the animal is initially in the woods, what is the probability that it is in the woods on the next three observations? (3) If the animal is initially in the woods, what is the probability that it is in the meadow on the next three observations?arrow_forwardQ8 A desk lamp produced by DavidLee Company was found to be defective (D). There are three factories (A, B, C) where such desk lamps are manufactured. A Quality Control Manager (QCM) is responsible for investigating the source of found defects. This is what the QCM knows about the company's desk lamp production and the possible source of defects: Factory A B с % of Total Production 25%, or P(A) = 0.25 35%, or P(B) = 0.35 40%, or P(C)=0.40 % of defective 3.5%, or P(D/A) =0.035 4.5%, or P(D/B) = 0.045 6.5%, or P(D/C) = 0.065 If 100 products are randomly selected from these three factories, how many defects will be found?arrow_forwardanswer in 30 minutes.arrow_forward
- A motion picture industry analyst is studying movies based on epic novels. The following data were obtained for 10 Hollywood movies made in the past five years. Each movie was based on an epic novel. For these data, x1 = first-year box office receipts of the movie, x2 = total production costs of the movie, x3 = total promotional costs of the movie, and x4 = total book sales prior to movie release. All units are in millions of dollars. x1 x2 x3 x4 85.1 8.5 5.1 4.7 106.3 12.9 5.8 8.8 50.2 5.2 2.1 15.1 130.6 10.7 8.4 12.2 54.8 3.1 2.9 10.6 30.3 3.5 1.2 3.5 79.4 9.2 3.7 9.7 91.0 9.0 7.6 5.9 135.4 15.1 7.7 20.8 89.3 10.2 4.5 7.9 a) Find a 90% confidence interval for each coefficient. (Use 2 decimal places.) lower limit upper limit ?2 ?3 ?4 b) Suppose a new movie (based on an epic novel) has just been released. Production costs were x2 = 11.4 million; promotion costs were x3 = 4.7 million; book sales were x4 = 8.1 million. Make a…arrow_forwardYou randomly recruit 23 students and tell each of them to come to the lab in two different mornings: each morning they will be offered some breakfast and will take a test. Each student will receive the light breakfast one time and the nutritious breakfast the other time (some will receive the light breakfast first, the others will receive the nutritious breakfast first, and the second time they switch). The average difference in a student’s score after eating the nutritious breakfast and their score after eating a light breakfast is 4.5, and the standard deviation of this difference is 3.6. (a) Construct a 95% confidence interval for the difference in the average score of students after having a nutritious breakfast and the average score of students after having a light breakfast.arrow_forwardRABCD X₁ 12 20 2 A researcher is interested in seeing if listening to a political debate changes anxiety scores among people. The researcher knows of no previous research that would predict whether anxiety scores would be raised or lowered. The researcher gathers a sample of n = 4, and gives these participants an anxiety test before and after listening to the political debate. Below are the data (anxiety scores) at time one (X₁) and time two (X₂) for all participants. Participant 10 10 X₂ 28 24 26 18 b.) Is this a one or a two-tailed test? a.) State the researcher's null and alternative hypotheses (using symbols OR everyday language): c.) Find the critical value (alpha = .05) d.) Compute the observed test statistic (remember to show your work) 5 e.) Based on the information above, what is your statistical conclusion? f.) Describe briefly what we can conclude in practical terms 6 g.) Based on the results above, calculate a Cohen's d and interpret what this tells us about the difference…arrow_forward
arrow_back_ios
arrow_forward_ios
Recommended textbooks for you
- MATLAB: An Introduction with ApplicationsStatisticsISBN:9781119256830Author:Amos GilatPublisher:John Wiley & Sons Inc
 Probability and Statistics for Engineering and th...StatisticsISBN:9781305251809Author:Jay L. DevorePublisher:Cengage Learning
 Statistics for The Behavioral Sciences (MindTap C...StatisticsISBN:9781305504912Author:Frederick J Gravetter, Larry B. WallnauPublisher:Cengage Learning
  Elementary Statistics: Picturing the World (7th E...StatisticsISBN:9780134683416Author:Ron Larson, Betsy FarberPublisher:PEARSON
 The Basic Practice of StatisticsStatisticsISBN:9781319042578Author:David S. Moore, William I. Notz, Michael A. FlignerPublisher:W. H. Freeman
 Introduction to the Practice of StatisticsStatisticsISBN:9781319013387Author:David S. Moore, George P. McCabe, Bruce A. CraigPublisher:W. H. Freeman
MATLAB: An Introduction with Applications
Statistics
ISBN:9781119256830
Author:Amos Gilat
Publisher:John Wiley & Sons Inc
Probability and Statistics for Engineering and th...
Statistics
ISBN:9781305251809
Author:Jay L. Devore
Publisher:Cengage Learning
Statistics for The Behavioral Sciences (MindTap C...
Statistics
ISBN:9781305504912
Author:Frederick J Gravetter, Larry B. Wallnau
Publisher:Cengage Learning
Elementary Statistics: Picturing the World (7th E...
Statistics
ISBN:9780134683416
Author:Ron Larson, Betsy Farber
Publisher:PEARSON
The Basic Practice of Statistics
Statistics
ISBN:9781319042578
Author:David S. Moore, William I. Notz, Michael A. Fligner
Publisher:W. H. Freeman
Introduction to the Practice of Statistics
Statistics
ISBN:9781319013387
Author:David S. Moore, George P. McCabe, Bruce A. Craig
Publisher:W. H. Freeman