
FINANCIAL ACCOUNTING
10th Edition
ISBN: 9781259964947
Author: Libby
Publisher: MCG
expand_more
expand_more
format_list_bulleted
Related questions
Question
Calculate the ratios of Coles group of Australia for the year 2019:
Ratios to calculate:
Profitability (ROSF, ROCE, Gross margin, Operating profit margin,
Efficiency (Inventory turnover period, Average settlement period, Sales revenue to capital employed)
Stability/Capital Structure (Gearing ratio, Interest cover ratio, Debt coverage ratio*)
Investment/Market Performance (Earnings per share, Price earnings ratio, Operating cash flow per share*)
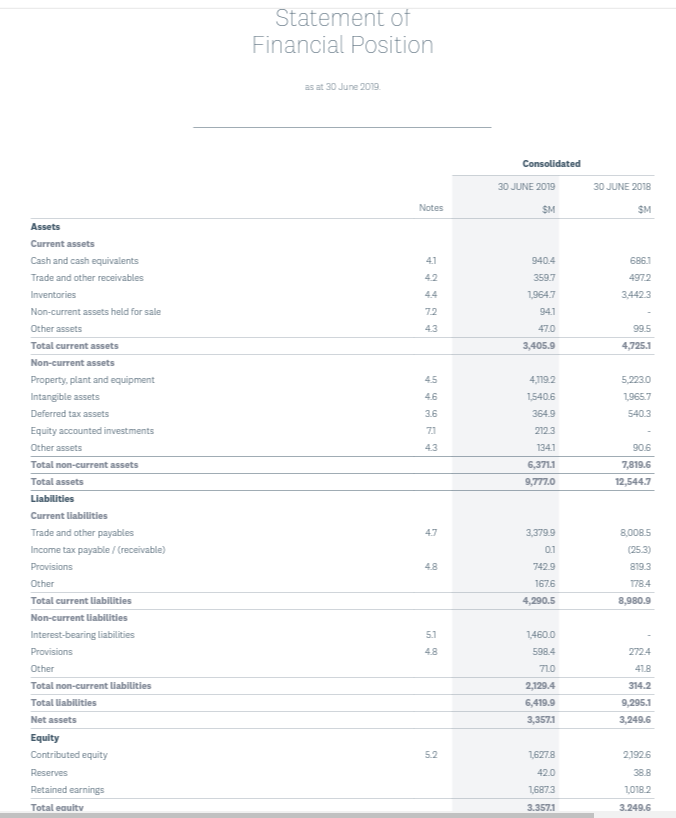

Transcribed Image Text:Assets
Current assets
Cash and cash equivalents
Trade and other receivables
Inventories
Non-current assets held for sale
Other assets
Total current assets
Non-current assets
Property, plant and equipment
Intangible assets
Deferred tax assets
Equity accounted investments
Other assets
Total non-current assets
Total assets
Liabilities
Current liabilities
Trade and other payables
Income tax payable/ (receivable)
Provisions
Other
Total current liabilities
Non-current liabilities
Interest-bearing liabilities
Provisions
Other
Total non-current liabilities
Total liabilities
Net assets
Equity
Contributed equity
Reserves
Retained earnings
Total equitv
Statement of
Financial Position
as at 30 June 2019.
Notes
41
4.2
72
4.3
45
46
3.6
71
4.3
47
4.8
5.1
4.8
5.2
Consolidated
30 JUNE 2019
SM
940.4
359.7
1,964.7
94.1
47.0
3,405.9
4,119.2
1,540.6
364.9
212.3
134.1
6,371.1
9,777.0
3,379.9
0.1
742.9
167.6
4,290.5
1,460.0
598.4
710
2,129.4
6,419.9
3,357.1
1,627.8
42.0
1,687.3
3.357.1
30 JUNE 2018
SM
686.1
497.2
3,442.3
99.5
4,725.1
5,223.0
1,965.7
540.3
90.6
7,819.6
12,544.7
8,008.5
(25.3)
819.3
178.4
8,980.9
272.4
41.8
314.2
9,295.1
3,249.6
2,192.6
38.8
1,018.2
3.249.6

Transcribed Image Text:Continuing operations
Sales revenue
Other operating revenue
Total operating revenue
Cost of sales
Gross profit
Other income
Administration expenses
Other expenses
Share of net profit of equity accounted investments
Earnings before interest and tax (EBIT)
Financing costs
Profit before income tax
Income tax expense
Profit for the year from continuing operations
Discontinued operations
Profit from discontinued operations after tax
Profit for the year
Statement of
Profit or LosS
for the year ended 30 June 2019.
Profit attributable to:
Equity holders of the parent entity
Earnings per share (EPS) attributable to equity holders of the Company
Basic and diluted EPS (cents)
EPS attributable to equity holders of the Company from continuing operations
Basic and diluted EPS (cents)
Notes
3.3
3.4
7.1
3.5
3.6
7.3
3.2
Consolidated
YEAR ENDED
30 JUNE 2019
SM
38,175.8
288.4
38,464.2
(29,253.4)
9,210.8
427.7
(8,0310)
(145.8)
5.0
1,466.7
(41.5)
1,425.2
(347.0)
1,078.2
356.5
1,434.7
1,434.7
107.6
80.8
YEAR ENDED
30 JUNE 2018
SM
38,934.4
211.0
39,145.4
(30,119.3)
9,026.1
168.7
(7,731.7)
16.3
1,479.4
(0.1)
1,479.3
(456.1)
1,023.2
555.6
1,578.8
1,578.8
118.4
76.7
Expert Solution
This question has been solved!
Explore an expertly crafted, step-by-step solution for a thorough understanding of key concepts.

Step by stepSolved in 4 steps

Knowledge Booster


Learn more about
Need a deep-dive on the concept behind this application? Look no further. Learn more about this topic, accounting and related others by exploring similar questions and additional content below.Similar questions
- Selected financial data for Bahama Bay and Caribbean Key are as follows:Required:1. Calculate the debt to equity ratio for Bahama Bay and Caribbean Key for the most recent year. Which company has the higher ratio?2. Calculate the return on assets for Bahama Bay and Caribbean Key. Which company appears more profitable?3. Calculate the times interest earned ratio for Bahama Bay and Caribbean Key. Which company is better able to meet interest payments as they become due?arrow_forward1. Provide a Liquidity Ratio Analysis based on the current Ratio. 2. Provide a Profitability ratio Analysis based on the following: - ROA - ROE - Overseas Sales Ratio - Cost of Sales to Net Assets - Gross Profit to Net salesarrow_forwardDuPont system of analysis Use the following financial information for AT&T and Verizon to conduct a DuPont system of analysis for each company. Sales Earnings available for common stockholders Total assets Stockholders' equity a. Which company has the higher net profit margin? Higher asset turnover? b. Which company has the higher ROA? The higher ROE? c. Which company has the higher financial leverage multiplier? a. Net profit margin (Round to three decimal places.) AT&T Net profit margin AT&T $164,000 13,333 403,921 201,934 Verizon Verizon $126,280 13,608 244,280 24,232arrow_forward
- With a given information below: (A) Prepare Income Statement and Balance Sheet in the Year 2020. (B) Analyze Income Statement and Balance Sheet in the Year 2020 Vertically. (C) Compute Financial Ratios: (1) ROE, (2) ROA, (3) Average Collection Period, (4) Debt to Asset, (5) Debt to Equity, (6) Time Interest Earned, (7) Total Assets Turnover, (8) Operating Profit Margin, (9) Return On Common Equity (ROCE), (10) Net Working Capital Ratio, (11) Quick Ratio, (12) Current Ratio. Cash $6,000 Sales $100,000 Utility Expense $8,000 Buildings $65,000 Common Stock $45,000 Accounts Payable $12,000 Supplies $4,000 Cost of Goods Sold $58,000 Interest Expense $5,000 Additional Paid in Capital $20,000 Bonds Payable $40,000 Supplies Expense $3,000 Salaries Expense $16,000 Accounts Receivable $10,000 Inventories $45,000 Retained Earnings $5,000 (beg. bal.) Income Tax Rate 20%arrow_forwardCostco Financial Analysis. Perform the following ratio analysis for 2021, 2022, and 2023 for Costco using the attached financial statements. a. Profitability ratios b. Liquidity ratios c. Leverage ratios d. Activity ratios e. Price to earnings ratioarrow_forwardDiscuss on Credit Risk of Nordstrom Time-series analysis Analyze credit risk in the past and current years (You may obtain information about firms’ credit ratings from financial articles as well); trend analysis Cross-sectional analysis - How do you think about current and future firm value? Discuss on Profitability: - Time-series analysis Analyze profitability in the past and current years; Can you find patterns or trends over the three years? Cross-sectional analysisarrow_forward
- Calculate the ratios of Woolworths Group (Australian retail company) for the year 2021: Ratios to calculate: Profitability (ROSF, ROCE, Gross margin, Operating profit margin, Cash flow to Sales*) Efficiency (Inventory turnover period, Average settlement period, Sales revenue to capital employed) Liquidity (Current ratio, Acid test (quick) ratio, Cash flow ratio*). Stability/Capital Structure (Gearing ratio, Interest cover ratio, Debt coverage ratio*) Investment/Market Performance (Earnings per share, Price earnings ratio, Operating cash flow per share*)arrow_forwardThe image uploaded is the calculation of Access Bank's Profitability ratios, shorter liquidity ratios, long-term liquidity ratios, and investment ratios for 2020, 2021, 2022. A base year of 2019 was also added. Evaluate the financial performance by comparing the three (3) years' financial performance that is 2020, 2021, and 2022 I have provided in the table with the base year.arrow_forwardIf given the opportunity, in which of the firms would you invest based on the result of your analysis of both companies and the comparison with the industry? If you would not invest, explain your reasons according to the results obtained. Company Name: Year 2018 Chemicals and Allied Products Industry Ratios ………….. Solvency or Debt Ratios Merck J&J 2018 Debt ratio 0.67 0.61 0.47 Debt-to-equity ratio 0.93 0.51 0.38 Interest coverage ratio 12.27 18.91 -9.43 Liquidity Ratios Current ratio 1.17 1.47 3.47 Quick ratio 0.92 1.16 2.12 Cash ratio 0.40 0.63 2.24 Profitability Ratios Profit margin 14.64% 18.75% -93.4% ROE (Return on equity), after tax 23.03% 25.60% -248.5 ROA (Return on assets) 7.49% 10.00% -146.5 Gross margin 68.06% 66.79% 55.3% Operating margin (Return on sales) 19.62% 24.27%…arrow_forward
- provide reasons for the attached calculated ratios using GSK 2023 annual report and provide non-financail performance analysis examples for GSK 2023.arrow_forwardFor Financial year 2021: Current ratio = Current assets / Current liabilities = 43.133 / 29.613 = 1.46 (2.d.p) Debt-to-equity = Total liabilities / Total equity = (29.613 + 25.382) / 47.069 = 1.17 (2.d.p) Return on total assets = Net profit / Average total assets = (-11.195) / 101.964 = -0.11 (2.d.p) Profit margin ratio = Net profit / Net sales = (-11.195) / 81.79 = -0.14 (2.d.p) Debt-to-asset = Total liabilities / Total assets = (29.613 + 25.382) / 101.964 = 0.54 (2.d.p) Cash flow on total assets = Net cash flow from operating activities / Average total assets = 4.717 / 101.964 = 0.05 (2.d.p) For Financial year 2022: Current ratio = Current assets / Current liabilities = 49.476 / 32.754 = 1.51 (2.d.p) Debt-to-equity = Total liabilities / Total equity = (32.754 + 27.625) / 46.732 = 1.29 (2.d.p) Return on total assets = Net profit / Average total assets = (-0.336) / 107.111 = -0.003 (3.d.p) Profit margin ratio = Net profit / Net sales = (-0.336) / 115.56 = -0.003 (3.d.p) Debt-to-asset…arrow_forwardUsing the financial statements in the image, calculate the following ratios for both the FY 2017 and FY 2018: Current Ratio Quick Ratio Total Asset Turnover Average Collection Total Debt to Total Assets Times Interest Earned Net Profit Margin Return on Assets Return on Equity Modified Du Point Equation for FY 2018 PE Ratio Market to Book Ratioarrow_forward
arrow_back_ios
SEE MORE QUESTIONS
arrow_forward_ios
Recommended textbooks for you
 AccountingAccountingISBN:9781337272094Author:WARREN, Carl S., Reeve, James M., Duchac, Jonathan E.Publisher:Cengage Learning,
 Accounting Information SystemsAccountingISBN:9781337619202Author:Hall, James A.Publisher:Cengage Learning,
 Horngren's Cost Accounting: A Managerial Emphasis...AccountingISBN:9780134475585Author:Srikant M. Datar, Madhav V. RajanPublisher:PEARSON
 Intermediate AccountingAccountingISBN:9781259722660Author:J. David Spiceland, Mark W. Nelson, Wayne M ThomasPublisher:McGraw-Hill Education
 Financial and Managerial AccountingAccountingISBN:9781259726705Author:John J Wild, Ken W. Shaw, Barbara Chiappetta Fundamental Accounting PrinciplesPublisher:McGraw-Hill Education
Accounting
Accounting
ISBN:9781337272094
Author:WARREN, Carl S., Reeve, James M., Duchac, Jonathan E.
Publisher:Cengage Learning,
Accounting Information Systems
Accounting
ISBN:9781337619202
Author:Hall, James A.
Publisher:Cengage Learning,
Horngren's Cost Accounting: A Managerial Emphasis...
Accounting
ISBN:9780134475585
Author:Srikant M. Datar, Madhav V. Rajan
Publisher:PEARSON
Intermediate Accounting
Accounting
ISBN:9781259722660
Author:J. David Spiceland, Mark W. Nelson, Wayne M Thomas
Publisher:McGraw-Hill Education
Financial and Managerial Accounting
Accounting
ISBN:9781259726705
Author:John J Wild, Ken W. Shaw, Barbara Chiappetta Fundamental Accounting Principles
Publisher:McGraw-Hill Education