
MATLAB: An Introduction with Applications
6th Edition
ISBN: 9781119256830
Author: Amos Gilat
Publisher: John Wiley & Sons Inc
expand_more
expand_more
format_list_bulleted
Related questions
Question
thumb_up100%
APPLIED STATISTICS
UPVOTE WILL BE GIVEN.
YOU MAY USE EXCEL OR IBM SPSS. PLEASE WRITE/TYPE THE COMPLETE SOLUTIONS. TAKE A SCREENSHOT IF EXCEL OR SPSS IS BEING USED.
An article in Technometrics by S. C. Narula and J. F. Wellington (“Prediction, Linear Regression, and a Minimum Sum of Relative Errors,” Vol. 19, 1977) presents data on the selling price (y) and annual taxes (x) for 24 houses. The taxes include local, school and county taxes. The data are shown in the table below. Calculate the least square estimates of slope and intercept.
Answer letter D.
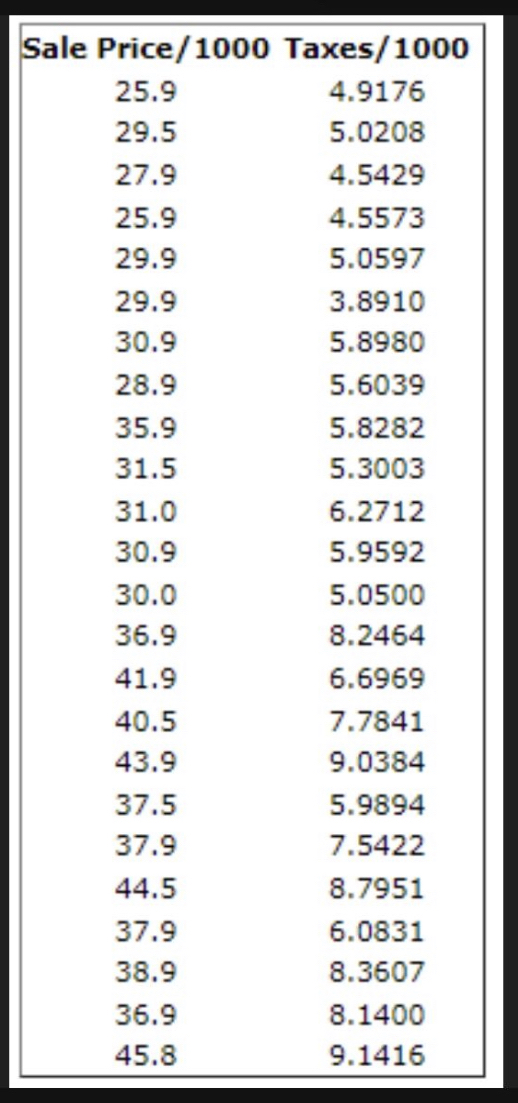

Transcribed Image Text:Sale Price/1000
25.9
29.5
27.9
25.9
29.9
29.9
30.9
28.9
35.9
31.5
31.0
30.9
30.0
36.9
41.9
40.5
43.9
37.5
37.9
44.5
37.9
38.9
36.9
45.8
Taxes/1000
4.9176
5.0208
4.5429
4.5573
5.0597
3.8910
5.8980
5.6039
5.8282
5.3003
6.2712
5.9592
5.0500
8.2464
6.6969
7.7841
9.0384
5.9894
7.5422
8.7951
6.0831
8.3607
8.1400
9.1416

Transcribed Image Text:(d) Calculate the fitted ŷ; for each value of x, used to fit the
model. Then construct a graph of ŷ, versus the correspon-
ding observed value y, and comment on what this plot
would look like if the relationship between y and x was a
deterministic (no random error) straight line. Does the
plot actually obtained indicate that taxes paid is an effec-
tive regressor variable in predicting selling price?
Expert Solution
This question has been solved!
Explore an expertly crafted, step-by-step solution for a thorough understanding of key concepts.

Step by stepSolved in 2 steps with 3 images

Knowledge Booster

Similar questions
- Statistics Canada produces consumer price indexes for several different categories. Shown here are the percentage changes in consumer price indexes over a period of 22 years for durable goods, semidurable goods, and nondurable goods. Also displayed are the percentage changes in total goods price index. Use these data and multiple regression to develop a model that attempts to predict the total goods index by the other three variables. Comment on the result of this analysis. Year TotalGoods DurableGoods SemidurableGoods NondurableGoods 1 85.7 89.4 91.9 83.2 2 86.4 90.4 92.5 83.8 3 87.8 92.5 93.4 85.2 4 86.8 96.0 94.2 81.6 5 88.4 99.0 94.9 82.9 6 89.9 100.8 95.4 84.4 7 91.2 101.6 97.0 86.0 8 91.4 101.5 97.7 86.1 9 93.1 101.5 99.2 88.4 10 96.0 100.8 99.6 93.3 11 98.4 100.1 100.3 97.4 12 100 100 100 100 13 101.9 99.2…arrow_forwardCan that regression be used to estimate the effect of the national unemployment rate on an individual’s earnings? Explain.arrow_forwardRequiredPage 92 The company uses the number of professional hours as the cost driver for office support costs. Use an algebraic equation to describe how total office support costs can be estimated. Use a spreadsheet program to perform a regression analysis. Use office support costs as the dependent variable (Y) and the professional hours as the independent variable (X). Determine the total fixed cost per office and variable cost per professional hour. Identify the R2 statistic provided by the Excel program and explain what it means. Mr. Dean plans to open a new branch office in a Dallas suburb. He expects that the monthly professional hours will be 3,000. Estimate the total office support cost for Mr. Dean. What portion of the total cost is fixed and what portion is variable? Explain how multiple regression analysis could be used to improve the accuracy of the cost estimates. *You will use excel to setup a worksheet with your data and run regression analysis.*arrow_forward
- Range of ankle motion is a contributing factor to falls among the elderly. Suppose a team of researchers is studying how compression hosiery, typical shoes, and medical shoes affect range of ankle motion. In particular, note the variables Barefoot and Footwear2. Barefoot represents a subject's range of ankle motion (in degrees) while barefoot, and Footwear2 represents their range of ankle motion (in degrees) while wearing medical shoes. Use this data and your preferred software to calculate the equation of the least-squares linear regression line to predict a subject's range of ankle motion while wearing medical shoes, ?̂ , based on their range of ankle motion while barefoot, ? . Round your coefficients to two decimal places of precision. ?̂ = A physical therapist determines that her patient Jan has a range of ankle motion of 7.26°7.26° while barefoot. Predict Jan's range of ankle motion while wearing medical shoes, ?̂ . Round your answer to two decimal places. ?̂ = Suppose Jan's…arrow_forwardWhat is Data Mining? Justify the use of data mining to support the use of multiple regression.arrow_forwardDoes the Regression line give information about all the data points in the data set? Does the Regression line usually have all the points in the data set on it?arrow_forward
arrow_back_ios
arrow_forward_ios
Recommended textbooks for you
- MATLAB: An Introduction with ApplicationsStatisticsISBN:9781119256830Author:Amos GilatPublisher:John Wiley & Sons Inc
 Probability and Statistics for Engineering and th...StatisticsISBN:9781305251809Author:Jay L. DevorePublisher:Cengage Learning
 Statistics for The Behavioral Sciences (MindTap C...StatisticsISBN:9781305504912Author:Frederick J Gravetter, Larry B. WallnauPublisher:Cengage Learning
  Elementary Statistics: Picturing the World (7th E...StatisticsISBN:9780134683416Author:Ron Larson, Betsy FarberPublisher:PEARSON
 The Basic Practice of StatisticsStatisticsISBN:9781319042578Author:David S. Moore, William I. Notz, Michael A. FlignerPublisher:W. H. Freeman
 Introduction to the Practice of StatisticsStatisticsISBN:9781319013387Author:David S. Moore, George P. McCabe, Bruce A. CraigPublisher:W. H. Freeman
MATLAB: An Introduction with Applications
Statistics
ISBN:9781119256830
Author:Amos Gilat
Publisher:John Wiley & Sons Inc
Probability and Statistics for Engineering and th...
Statistics
ISBN:9781305251809
Author:Jay L. Devore
Publisher:Cengage Learning
Statistics for The Behavioral Sciences (MindTap C...
Statistics
ISBN:9781305504912
Author:Frederick J Gravetter, Larry B. Wallnau
Publisher:Cengage Learning
Elementary Statistics: Picturing the World (7th E...
Statistics
ISBN:9780134683416
Author:Ron Larson, Betsy Farber
Publisher:PEARSON
The Basic Practice of Statistics
Statistics
ISBN:9781319042578
Author:David S. Moore, William I. Notz, Michael A. Fligner
Publisher:W. H. Freeman
Introduction to the Practice of Statistics
Statistics
ISBN:9781319013387
Author:David S. Moore, George P. McCabe, Bruce A. Craig
Publisher:W. H. Freeman