
MATLAB: An Introduction with Applications
6th Edition
ISBN: 9781119256830
Author: Amos Gilat
Publisher: John Wiley & Sons Inc
expand_more
expand_more
format_list_bulleted
Related questions
Concept explainers
Question
thumb_up100%
A . Calculate the equation of the LSRL. Round the slope & y-intercept to 2 decimal places.
B . What is the meaning of the slope (use context)
C . Write the correlation coefficient for this data

Transcribed Image Text:3
6
8
12 points
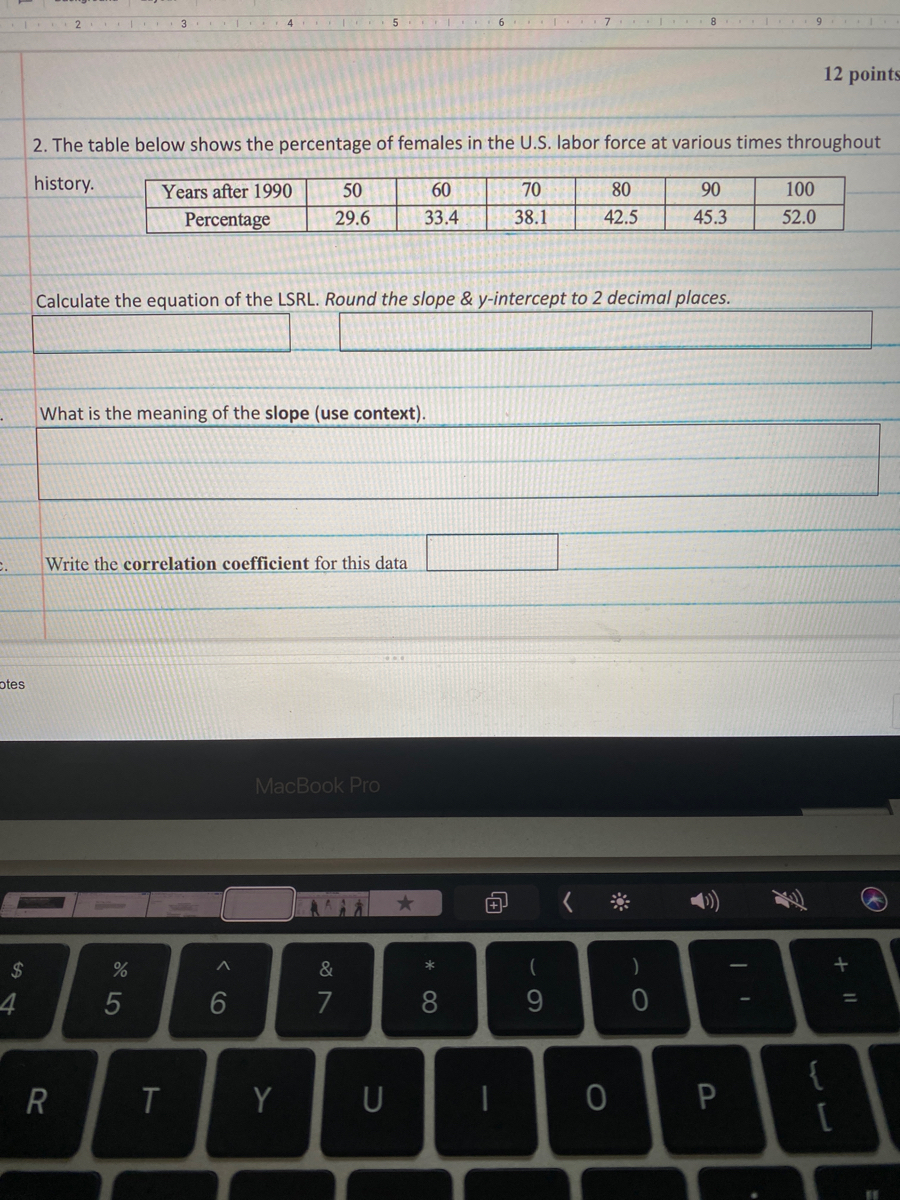
2. The table below shows the percentage of females in the U.S. labor force at various times throughout
history.
Years after 1990
50
60
70
80
90
100
Percentage
29.6
33.4
38.1
42.5
45.3
52.0
Calculate the equation of the LSRL. Round the slope & y-intercept to 2 decimal places.
What is the meaning of the slope (use context).
Write the correlation coefficient for this data
ptes
MacBook Pro
$
&
4
5
6
7
8
{
Y
U
P
Expert Solution
This question has been solved!
Explore an expertly crafted, step-by-step solution for a thorough understanding of key concepts.

This is a popular solution

Trending nowThis is a popular solution!

Step by stepSolved in 3 steps

Knowledge Booster


Learn more about
Need a deep-dive on the concept behind this application? Look no further. Learn more about this topic, statistics and related others by exploring similar questions and additional content below.Similar questions
- Please explain step by step how you solved for each problem, and where the numbers came from.arrow_forwardMatch the correlation coefficients with their scatterplots. Select the letter of the scatterplot below which corresponds to the correlation coefficient. (Click on image for a larger view.) B v 1. r = -0.74 с A ✓ 2. r = -0.49 3. r = -0.97 4. r = 0.76 A B Darrow_forwardUse the data in the table, which shows the average annual salaries (both in thousands of dollars) for public school principals and teachers in the U.S. for 11 years. Apply what you have learned in the previous tab to complete this graded lab questions. 1. Repeat the steps from tab #1 using this data to construct a scatter plot graph and calculate the correlation coefficient R. (Recall the corelation coefficient is R and not R Teachers y Principalsx 77.8 43.7 78.4 43.8 80.8 45.0 R= 80.5 45.6, 2. Does the R value represent a positive, negative or no correlation between the salaries ol the teachers and principals? As teacher salaries increase, what happens to prinicipal salaries? 10 11 81.5 45.9 84.8 48.2 12 13 87.7 49,3 3. Write the equation of the regression line for the data below. The equation is y= 14 91.6 51.3 52.9 Teachers y 15 16 95.7 54.4 COD 54.2 =D0.5873x-2.0s07o R=0.995, 17 95.7 4. Use the regression equation that you found in exercise #3 to predict the average annual salary…arrow_forward
- Please help with these questions.arrow_forwardSolve for the slope, y-intercept, equation of the trend line, the correlation coefficient, and the coefficient of determination for the following the data set. Show your work and explain the steps you used to solve. Round your answer to the nearest hundredth.arrow_forwardHello there, please help me with this problem and thank you!arrow_forward
arrow_back_ios
arrow_forward_ios
Recommended textbooks for you
- MATLAB: An Introduction with ApplicationsStatisticsISBN:9781119256830Author:Amos GilatPublisher:John Wiley & Sons Inc
 Probability and Statistics for Engineering and th...StatisticsISBN:9781305251809Author:Jay L. DevorePublisher:Cengage Learning
 Statistics for The Behavioral Sciences (MindTap C...StatisticsISBN:9781305504912Author:Frederick J Gravetter, Larry B. WallnauPublisher:Cengage Learning
  Elementary Statistics: Picturing the World (7th E...StatisticsISBN:9780134683416Author:Ron Larson, Betsy FarberPublisher:PEARSON
 The Basic Practice of StatisticsStatisticsISBN:9781319042578Author:David S. Moore, William I. Notz, Michael A. FlignerPublisher:W. H. Freeman
 Introduction to the Practice of StatisticsStatisticsISBN:9781319013387Author:David S. Moore, George P. McCabe, Bruce A. CraigPublisher:W. H. Freeman
MATLAB: An Introduction with Applications
Statistics
ISBN:9781119256830
Author:Amos Gilat
Publisher:John Wiley & Sons Inc
Probability and Statistics for Engineering and th...
Statistics
ISBN:9781305251809
Author:Jay L. Devore
Publisher:Cengage Learning
Statistics for The Behavioral Sciences (MindTap C...
Statistics
ISBN:9781305504912
Author:Frederick J Gravetter, Larry B. Wallnau
Publisher:Cengage Learning
Elementary Statistics: Picturing the World (7th E...
Statistics
ISBN:9780134683416
Author:Ron Larson, Betsy Farber
Publisher:PEARSON
The Basic Practice of Statistics
Statistics
ISBN:9781319042578
Author:David S. Moore, William I. Notz, Michael A. Fligner
Publisher:W. H. Freeman
Introduction to the Practice of Statistics
Statistics
ISBN:9781319013387
Author:David S. Moore, George P. McCabe, Bruce A. Craig
Publisher:W. H. Freeman