
MATLAB: An Introduction with Applications
6th Edition
ISBN: 9781119256830
Author: Amos Gilat
Publisher: John Wiley & Sons Inc
expand_more
expand_more
format_list_bulleted
Related questions
Question
thumb_up100%
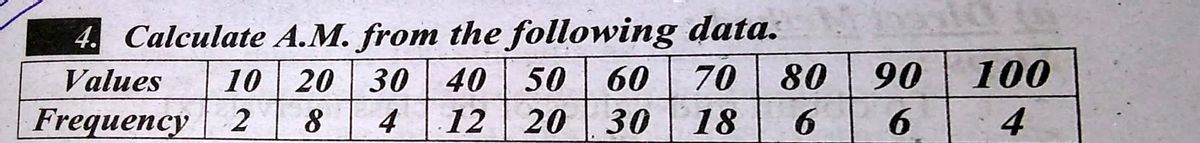

Transcribed Image Text:4. Calculate A.M. from the following data.
70 80
12 20 30 18
Values
10 20 30 40 50
60
90
100
Frequency | 2
4
6.
4.
Expert Solution
This question has been solved!
Explore an expertly crafted, step-by-step solution for a thorough understanding of key concepts.

Step by stepSolved in 2 steps with 2 images

Knowledge Booster

Similar questions
- Q.9arrow_forwardPlease answer this. Show work.arrow_forwardAt Center Hospital there is some concern about the high turnover of nurses. A survey was done to determine how long (in months) nurses had been in their current positions. The responses (in months) of 20 nurses were 23 5 14 25 36 27 42 12 8 7 15 29 26 28 11 20 31 8 36 Find the interquartile range. O 37.5 O 19.0 O 22.5 O 38.0 19.5arrow_forward
- The following data set outlines the scores students had on an Algebra test. 41 42 43 43 43 43 43 44 44 44 44 45 45 45 45 i) Fill in the frequency table (below) Scores 7 6 5 4 3 2 40 43 44 45 1 39 ii) Draw a dot plot on the graph below. You do not need to show the entire column of dots, only the one on the top representing the frequency of the test score. Score 40 40 41 42 43 44 45 19 41 42 13 43 Frequency 44 45 40arrow_forward147 153 166 173 186 182 183 186 182 166 182 163 153 145 1. find the mean 2. what is meadian 3. what is the modearrow_forwardUse the data set listed and technology to create frequency histograms with 5, 10, and 20 classes. D 16 Frequency O C. 8 Frequency 12 4 10 1 1 04 8 12 16 Data Value 12 0 4 8 12 16 20 Data Value 1 4 8 12 16 20 Data Value 4 12 5 15 Create a histogram with 10 classes. Choose the correct histogram below. O A. 5 85 55 82 9 66 9 13 15 10 0 в. OD. Frequency Frequency 104 1954NG 648 12 16 Data Value TH 0 4 8 12 16 20 Data Value 10+ TU 4 8 12 16 20 Data Value G Earrow_forward
arrow_back_ios
arrow_forward_ios
Recommended textbooks for you
- MATLAB: An Introduction with ApplicationsStatisticsISBN:9781119256830Author:Amos GilatPublisher:John Wiley & Sons Inc
 Probability and Statistics for Engineering and th...StatisticsISBN:9781305251809Author:Jay L. DevorePublisher:Cengage Learning
 Statistics for The Behavioral Sciences (MindTap C...StatisticsISBN:9781305504912Author:Frederick J Gravetter, Larry B. WallnauPublisher:Cengage Learning
  Elementary Statistics: Picturing the World (7th E...StatisticsISBN:9780134683416Author:Ron Larson, Betsy FarberPublisher:PEARSON
 The Basic Practice of StatisticsStatisticsISBN:9781319042578Author:David S. Moore, William I. Notz, Michael A. FlignerPublisher:W. H. Freeman
 Introduction to the Practice of StatisticsStatisticsISBN:9781319013387Author:David S. Moore, George P. McCabe, Bruce A. CraigPublisher:W. H. Freeman
MATLAB: An Introduction with Applications
Statistics
ISBN:9781119256830
Author:Amos Gilat
Publisher:John Wiley & Sons Inc
Probability and Statistics for Engineering and th...
Statistics
ISBN:9781305251809
Author:Jay L. Devore
Publisher:Cengage Learning
Statistics for The Behavioral Sciences (MindTap C...
Statistics
ISBN:9781305504912
Author:Frederick J Gravetter, Larry B. Wallnau
Publisher:Cengage Learning
Elementary Statistics: Picturing the World (7th E...
Statistics
ISBN:9780134683416
Author:Ron Larson, Betsy Farber
Publisher:PEARSON
The Basic Practice of Statistics
Statistics
ISBN:9781319042578
Author:David S. Moore, William I. Notz, Michael A. Fligner
Publisher:W. H. Freeman
Introduction to the Practice of Statistics
Statistics
ISBN:9781319013387
Author:David S. Moore, George P. McCabe, Bruce A. Craig
Publisher:W. H. Freeman