
A First Course in Probability (10th Edition)
10th Edition
ISBN: 9780134753119
Author: Sheldon Ross
Publisher: PEARSON
expand_more
expand_more
format_list_bulleted
Related questions
Question
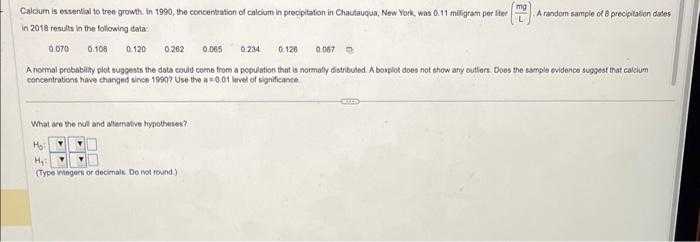

Transcribed Image Text:Calcium is essential to tree growth. In 1990, the concentration of calcium in precipitation in Chautauqua, New York, was 0.11 milligram per ter A random sample of 8 precipitation dates
in 2018 results in the following data
0.070
0.108 0.120 0.262
What are the null and alternative hypotheses?
Ho Y
H₂
(Type Integers or decimals. Do not round)
mg
0.065 0234 0:120 0.067
A normal probability plot suggests the data could come from a population that is normally distributed. A boxplot does not show any outliers. Does the sample evidence suggest that calcium
concentrations have changed since 1990? Use the a=0,01 level of significance
MELEN
NL
Expert Solution
This question has been solved!
Explore an expertly crafted, step-by-step solution for a thorough understanding of key concepts.

This is a popular solution

Trending nowThis is a popular solution!

Step by stepSolved in 5 steps with 11 images

Knowledge Booster

Similar questions
- In a 1868 paper, German physician Carl Wunderlich reported based on over a million body temperature readings that the mean body temperature for healthy adults is 98.6° F. However, it is now commonly believed that the mean body temperature of a healthy adult is less than what was reported in that paper. To test this hypothesis a researcher measures the following body temperatures from a random sample of healthy adults. 98.2, 98.6, 98.5, 98.6, 97.6, 98.2, 98.0 (a) Find the value of the test statistic. (b) Find the 10% critical value.arrow_forwardd. There is a 30% chance that X is above what value? X= (Type an integer or decimal rounded to two decimal places as needed.)arrow_forwardThe data found below measure the amounts of greenhouse gas emissions from three types of vehicles. The measurements are in tons per year, expressed as CO2 equivalents. Use a 0.025 significance level to test the claim that the different types of vehicle have the same mean amount of greenhouse gas emissions. Based on the results, does the type of vehicle appear to affect the amount of greenhouse gas emissions? A. Determine the test statistic. F= (Round to two decimal places as needed.) B. Identify the P-value. P-value= (Round to two decimal places as needed.)arrow_forward
- A researcher measures the relationship between hours worked by employed students and the number of units taken during the first semester of college for each individual in a group of 25 community college students. For this study: a. If we calculate the average hours worked by these community college students, the average would be an example of a ________ statistic b. Is a sample or population being measured here? c. What kind of a research study is this? d. N/n = e. What level of measurement is the number of units taken? Step 2 – check your work! Was your answer correct? If not, please make any correction here: Step 3 - if your answer was incorrect, please write out what was wrong (skip this if you were correct) show working for eacharrow_forward70 adults with gum disease were asked the number of times per week they used to floss before their diagnoses. The (incomplete) results are shown below: # of times floss per week Frequency Relative Frequency Cumulative Frequency 10 10 1 0.1 17 2 10 0.1429 27 8. 0.1143 35 4 7. 0.1 42 ? 0.1286 51 6 0.1 12 0.1714 70 a. Complete the table (Use 4 decimal places when applicable) b. What is the cumulative relative frequency for flossing 2 times per week?arrow_forwardA survey of the opinions of property owners about a street widening project was taken to determine whether the resulting opinion was related to the distance of front footage. A randomly selected sample of 100 property owners was contacted and the results are shown below. Opinion Front-Footage For Undecided Against Under 45 feet 12 4 4 45 – 120 feet 35 5 30 Over 120 feet 3 2 5 What is the computed value of chi-square? 5.4787 4.9985 9.2784 7.9842 11.0355arrow_forward
- a. What is the value of the standard error of the estimate (to 4 decima b. Test for a significant relationship by using thet test. Use a = 0.05. %3D What is the value of the t test statistic (to 2 decimals)? What is the p-value? Use Table 2 of Appendix B. Select your answer - What is your conclusion (a = 0.05)? %3D Select your answer - c. Use the F test to test for a significant relationship. Use a = 0.05.arrow_forwardRhino viruses typically cause common colds. In a test of the effectiveness of echinacea, 33 of the 38 subjects treated with echinacea developed rhinovirus infections. In a placebo group, 94 of the 111 subjects developed rhinovirus infections. Use a 0.01 significance level to test the claim that echinacea has an effect on rhinovirus infections. Complete parts (a) through (c) below. a. Test the claim using a hypothesis test. Consider the first sample to be the sample of subjects treated with echinacea and the second sample to be the sample of subjects treated with a placebo. What are the null and alternative hypotheses for the hypothesis test? O A. Ho: P1 #P2 Hy:P1 =P2 O B. Ho: P1 =P2 H1: P1 P2 H1: P1 #P2 Identify the test statistic. (Round to two decimal places as needed.) Identify the P-value. P-value = (Round to three decimal places as needed.) What is the conclusion based on the hypothesis test? the null hypothesis. There sufficient evidence to support the claim that echinacea…arrow_forwardListed below are the measured radiation absorption rates (in W/kg) corresponding to 11 cell phones. Use the given data to construct a boxplot and identify the 5-number summary. 1.16 0.61 0:87 1.27 1.46 0.73 1.09 1.04 1.48 0.52 0.63 The 5-number summary is and all in W/kg. (Use ascending order. Type integers or decimals. Do not round.)arrow_forward
arrow_back_ios
SEE MORE QUESTIONS
arrow_forward_ios
Recommended textbooks for you
- A First Course in Probability (10th Edition)ProbabilityISBN:9780134753119Author:Sheldon RossPublisher:PEARSON

A First Course in Probability (10th Edition)
Probability
ISBN:9780134753119
Author:Sheldon Ross
Publisher:PEARSON