
MATLAB: An Introduction with Applications
6th Edition
ISBN: 9781119256830
Author: Amos Gilat
Publisher: John Wiley & Sons Inc
expand_more
expand_more
format_list_bulleted
Related questions
Question
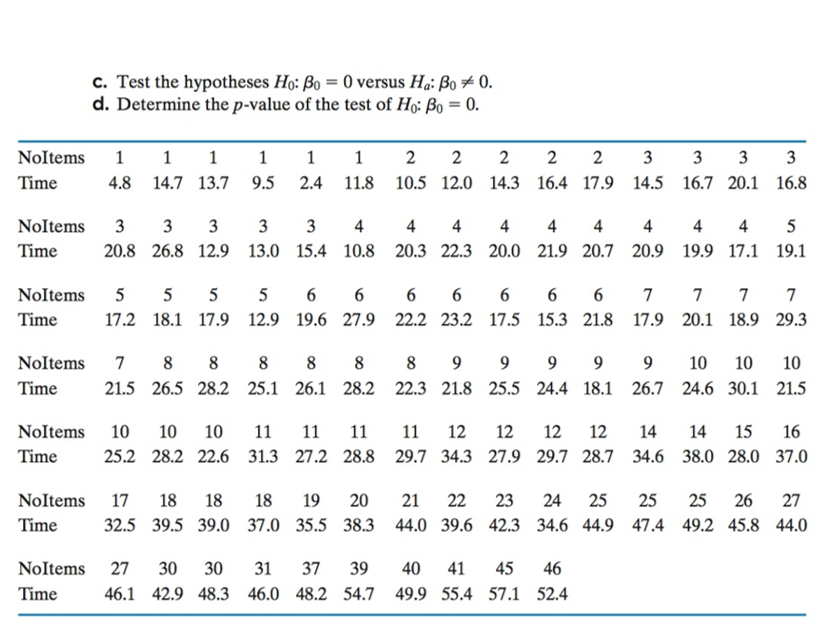

Transcribed Image Text:C. Test the hypotheses Но: ß0 0 versus Ha: ß04 0.
d. Determine the p-value of the test of Ho: Po 0
Noltems 1 1 1 1 22 22 233 33
Time 4.8 14.7 13.7 9.5 2.4 11.8 10.5 12.0 14.3 16.4 17.9 14.5 16.7 20.1 16.8
Noltems 3 3 3 3 3 44 4 44 5
Time 20.8 26.8 12.9 13.0 15.4 10.8 20.3 22.3 20.0 21.9 20.7 20.9 19.9 17.1 19.1
Noltems 5 5 5 5 6 6 6 6 6 6 6 777 7
Time17.2 18.1 17.9 12.9 19.6 27.9 22.2 23.2 17.5 15.3 21.8 17.9 20.1 18.9 29.3
Noltems 7 8 8 8 8 8 89 9 9 9 9 10 10 10
Time21.5 26.5 28.2 25.1 26.1 28.2 22.3 21.8 25.5 24.4 18.1 26.7 24.6 30.1 21.5
Noltems 10 10 10 11 1 12 12 12 12 14 14 15 16
Time25.2 28.2 22.6 31.3 27.2 28.8 29.7 34.3 27.9 29.7 28.7 34.6 38.0 28.0 37.0
Noltems 17 18 18 18 19 20 21 22 23 2425 25 25 26 27
Time32.5 39.5 39.0 37.0 35.5 38.3 44.0 39.6 42.3 34.6 44.9 47.4 49.2 45.8 44.0
Noltems 27 30 30 31 37 39 40 41 45 46
Time46.1 42.9 48.3 46.0 48.2 54.749.955.4 57.1 52.4
Expert Solution
This question has been solved!
Explore an expertly crafted, step-by-step solution for a thorough understanding of key concepts.

This is a popular solution

Trending nowThis is a popular solution!

Step by stepSolved in 3 steps with 1 images

Knowledge Booster

Similar questions
- Which combination would lead you to Fail to Reject H0? α = .01 p-value = .005 α = .05 p-value = .051 α = .01 p-value = .009 α = .05 p-value = .048arrow_forwardScenario: 200 people were asked, “Who is your favorite superhero?” Below are the data. Test the null hypothesis that the population frequencies for each category are equal. α= .05. Iron Man Black Panther Wonder Woman Spiderman fo = 40 fo = 60 fo =55 fo = 45 fe = fe = fe = fe = What is the correct result based on the data?arrow_forwardCan you justify the vaule shown in the picture for a case n= 3? what is the value of 5.196, 2pi, and 10.392 stand for?arrow_forward
- cen the othe tral wor 24. A researcher conducts a study comparing two dif- ferent treatments with a sample of n = 16 partici- pants in each treatment. The study produced the following data: study an mean nu tolerate Treatment 1: 6 7 11 4 19 17 2 5 9 13 6 23 11 4 6 1 tions. D tolerance Treatment 2: 10 9 6 61 11 8 6 3 2 11 1 127 10 9 Particip a. Calculate the mean for each treatment. Based on the two means, which treatment produces the higher scores? 2. b. Calculate the median for each treatment. Based on the two medians, which treatment produces the higher scores? 3. 4. 5. c. Calculate the mode for each treatment. Based on the two modes, which treatment produces the higher scores? L 0. 6arrow_forwardAnswers are attached plz look at thatarrow_forwardSolve second one question. If u know both solve all ..must solve qno2okk. See sample in other image.arrow_forward
- An insurance company reported that, on average, claims for a certain medical procedure are $942. An independent organization constructed a 95% confidence interval of ($930 , $950) for the average amount claimed for the particular medical procedure. What conclusion best evaluates the truthfulness of the number reported by the insurance company? a) With 95% certainty, the average claim for this medical procedure is $942.b) With 95% certainty, the average claim for this medical procedure is not $942.c) The confidence interval is consistent with an average claim of $942 for this medical procedure.d) With 100% certainty, the average claim for this medical procedure is $942arrow_forwardConvert to raw-scores μ = 3,0 = 2 Z 0.50 -1.00 2.37 -0.75 -1.49 2.64 -1.47 2.64 Blank 1; Blank 2; Blank 3; Blank 4; Blank 5; Blank 6; Blank 7; Blank 8 Blank 1 Blank 2 Blank 3 Blank 4 Blank 5 Blank 6 Blank 7 Blank 8 Add your answer Add your answer Add your answer Add your answer Add your answer Add your answer Add your answer Add your answer Brarrow_forward
arrow_back_ios
arrow_forward_ios
Recommended textbooks for you
- MATLAB: An Introduction with ApplicationsStatisticsISBN:9781119256830Author:Amos GilatPublisher:John Wiley & Sons Inc
 Probability and Statistics for Engineering and th...StatisticsISBN:9781305251809Author:Jay L. DevorePublisher:Cengage Learning
 Statistics for The Behavioral Sciences (MindTap C...StatisticsISBN:9781305504912Author:Frederick J Gravetter, Larry B. WallnauPublisher:Cengage Learning
  Elementary Statistics: Picturing the World (7th E...StatisticsISBN:9780134683416Author:Ron Larson, Betsy FarberPublisher:PEARSON
 The Basic Practice of StatisticsStatisticsISBN:9781319042578Author:David S. Moore, William I. Notz, Michael A. FlignerPublisher:W. H. Freeman
 Introduction to the Practice of StatisticsStatisticsISBN:9781319013387Author:David S. Moore, George P. McCabe, Bruce A. CraigPublisher:W. H. Freeman
MATLAB: An Introduction with Applications
Statistics
ISBN:9781119256830
Author:Amos Gilat
Publisher:John Wiley & Sons Inc
Probability and Statistics for Engineering and th...
Statistics
ISBN:9781305251809
Author:Jay L. Devore
Publisher:Cengage Learning
Statistics for The Behavioral Sciences (MindTap C...
Statistics
ISBN:9781305504912
Author:Frederick J Gravetter, Larry B. Wallnau
Publisher:Cengage Learning
Elementary Statistics: Picturing the World (7th E...
Statistics
ISBN:9780134683416
Author:Ron Larson, Betsy Farber
Publisher:PEARSON
The Basic Practice of Statistics
Statistics
ISBN:9781319042578
Author:David S. Moore, William I. Notz, Michael A. Fligner
Publisher:W. H. Freeman
Introduction to the Practice of Statistics
Statistics
ISBN:9781319013387
Author:David S. Moore, George P. McCabe, Bruce A. Craig
Publisher:W. H. Freeman