Advanced Engineering Mathematics
10th Edition
ISBN: 9780470458365
Author: Erwin Kreyszig
Publisher: Wiley, John & Sons, Incorporated
expand_more
expand_more
format_list_bulleted
Question

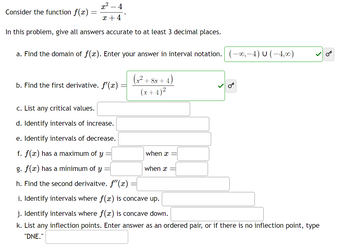
Transcribed Image Text:Consider the function f(x)
x² - 4
x +4
In this problem, give all answers accurate to at least 3 decimal places.
a. Find the domain of f(x). Enter your answer in interval notation. (-∞,—4) U (−4,∞)
b. Find the first derivative. f'(x)
(x² + 8x+4)
(x+4)²
c. List any critical values.
d. Identify intervals of increase.
e. Identify intervals of decrease.
f. f(x) has a maximum of y
g. f(x) has a minimum of y
h. Find the second derivaitve. f'(x)
i. Identify intervals where f(x) is concave up.
j. Identify intervals where f(x) is concave down.
k. List any inflection points. Enter answer as an ordered pair, or if there is no inflection point, type
"DNE."
when x
when x
OT
-
OT
Expert Solution
This question has been solved!
Explore an expertly crafted, step-by-step solution for a thorough understanding of key concepts.
This is a popular solution
Trending nowThis is a popular solution!
Step by stepSolved in 4 steps with 4 images

Knowledge Booster
Similar questions
- The is the difference between consecutive lower class limits. The is the difference between consecutive lower class limits. open ended table relative frequency frequency distribution category class widtharrow_forwardThe comparison line graph indicates the rainfall for the last six months of two different years in Nowhereville. 5- During what months was the rainfall of 2018 less than the rainfall of 2017? 2017 2018 July Aug Sept Oct Nov Dec Month ..... Select all of the months where the rainfall of 2018 was less than the rainfall of 2017. A. August B. July C. October D. November E. December F. September Rainfall (in inches)arrow_forwardFor each of the variables described below, indicate whether it is a quantitative or a categorical (qualitative) variable. Also, indicate the level of measurement for the variable: nominal, ordinal, interval, or ratio. Make sure your responses are the most specific possible. Variable Type of variable Level of measurement (a)Duration (in minutes) of a call to a customer support line Quantitative Categorical Nominal Ordinal Interval Ratio (b)Exchange on which a stock is traded (NYSE, AMEX, or other) Quantitative Categorical Nominal Ordinal Interval Ratio (c)Temperature (in degrees Celsius) Quantitative Categorical Nominal Ordinal Interval Ratioarrow_forward
- Assume that T is a linear transformation. Find the standard matrix of T.arrow_forwardAverage prices (in dollars) were recorded for three types of beverage across all 8 major Australian states and territories. In how many states/territories is the average price of a cappuccino higher than the average price of a flat white? x axis = states y axis = average pricesarrow_forwardThe following are considered statistical functions: AVERAGE, COUNT, MIN, MAX, MEDIAN AVERAGE, COUNT, MIN, VLOOKUP, IF AVERAGE, VLOOKUP, MIN, MAX, MEDIAN O AVERAGE, MEDIAN, VLOOKUP, IF, PMTarrow_forward
- calculate all appriate measures of variation for the interval data in data set a. show all work and demonstrate the use of formulas data a 5 6 10 2 5 15 13 4arrow_forwardFor each description of data, identify theW’s, name the variables, specify for each variable whether itsuse indicates that it should be treated as categorical or quantitative, and, for any quantitative variable, identify the units inwhich it was measured (or note that they were not provided). Arby’s menu A listing posted by the Arby’s restaurantchain gives, for each of the sandwiches it sells, the typeof meat in the sandwich, the number of calories, and theserving size in ounces. The data might be used to assessthe nutritional value of the different sandwiches.arrow_forwardThe graph below is an ogive of scores on a math test. The vertical axis in an ogive is the cumulative relative frequency and can also be interpreted as a percentile. Use the graph to approximate the percentile rank of an individual whose test score is 70. O A. 53 О В. 80 Percentile Ranks of Math Test Scores ОС. 75 O D. 58 100- 90- 80- 70- 60- 50- 40- 30- 20- 10- O 10 20 30 40 50 60 70 80 90 100 Click to select your answer. f6 17 fg ho escarrow_forward
- For each of the following scenarios, decide which graphical display is the BEST for which (pie chart, bar graph, stemplot, or histogram) you would use to describe the distribution of the variable. The monthly spending on shopping over th v[Choose ] past 12 months. Pie Chart Histogram The grades on the first exam in a statistics course for the 120 students enrolled in the Bar Graph Stemplot course. The favorite color of each student in the statistics course. [Choose) The number of students in the graduating high school class for each high school in [ Choose ) lowa. MacBook Pro 80 888 %23 $ & 3 4 6 8 E Y F J Karrow_forwardPls dont do handwritten and also explain concept and use excel formulas wherever required and not the statistics tables.arrow_forwardWhat is the definition of continuous data?arrow_forward
arrow_back_ios
SEE MORE QUESTIONS
arrow_forward_ios
Recommended textbooks for you
 Advanced Engineering MathematicsAdvanced MathISBN:9780470458365Author:Erwin KreyszigPublisher:Wiley, John & Sons, Incorporated
 Numerical Methods for EngineersAdvanced MathISBN:9780073397924Author:Steven C. Chapra Dr., Raymond P. CanalePublisher:McGraw-Hill Education
 Introductory Mathematics for Engineering Applicat...Advanced MathISBN:9781118141809Author:Nathan KlingbeilPublisher:WILEY
 Mathematics For Machine TechnologyAdvanced MathISBN:9781337798310Author:Peterson, John.Publisher:Cengage Learning,


Advanced Engineering Mathematics
Advanced Math
ISBN:9780470458365
Author:Erwin Kreyszig
Publisher:Wiley, John & Sons, Incorporated

Numerical Methods for Engineers
Advanced Math
ISBN:9780073397924
Author:Steven C. Chapra Dr., Raymond P. Canale
Publisher:McGraw-Hill Education

Introductory Mathematics for Engineering Applicat...
Advanced Math
ISBN:9781118141809
Author:Nathan Klingbeil
Publisher:WILEY

Mathematics For Machine Technology
Advanced Math
ISBN:9781337798310
Author:Peterson, John.
Publisher:Cengage Learning,

