
MATLAB: An Introduction with Applications
6th Edition
ISBN: 9781119256830
Author: Amos Gilat
Publisher: John Wiley & Sons Inc
expand_more
expand_more
format_list_bulleted
Related questions
Question
Please help with d e and g only
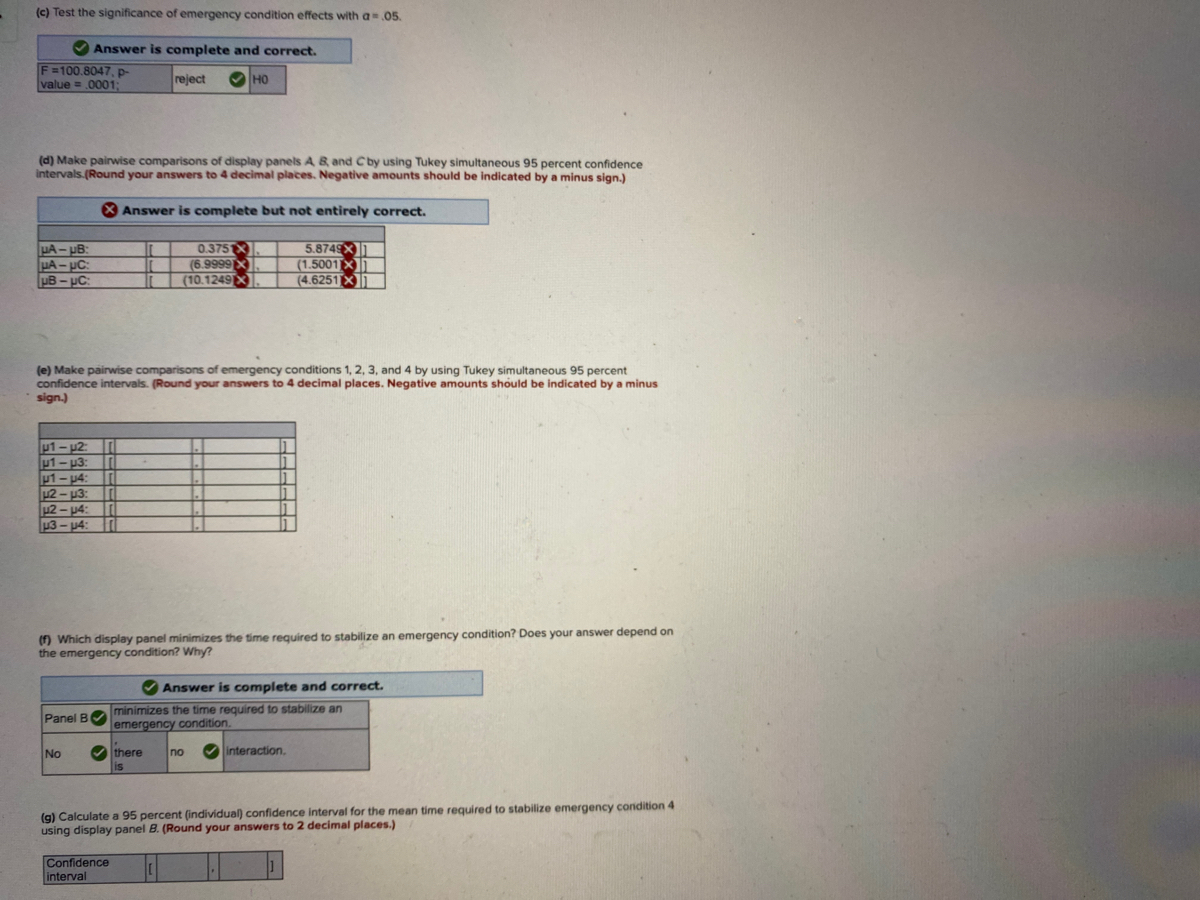

Transcribed Image Text:(c) Test the significance of emergency condition effects with a .05.
Answer is complete and correct.
F=100.8047,P-
value = .00013B
O HO
reject
(d) Make pairwise comparisons of display panels A 8, and Cby using Tukey simultaneous 95 percent confidence
intervals.(Round your answers to 4 decimal places. Negative amounts should be indicated by a minus sign.)
X Answer is complete but not entirely correct.
HA- UB:
µA-µC:
UB – µC:
0.375X
5.8749X
(1.5001X
(4.6251X
(6.9999
X
(10.1249X
(e) Make pairwise comparisons of emergency conditions 1, 2, 3, and 4 by using Tukey simultaneous 95 percent
confidence intervals. (Round your answers to 4 decimal places. Negative amounts should be indicated by a minus
sign.)
u1- u2
u1-u3:
u1- p4:
2- u3:
u2 - U4:
u3- p4:
() Which display panel minimizes the time required to stabilize an emergency condition? Does your answer depend on
the emergency condition? Why?
V Answer is complete and correct.
minimizes the time required to stabilize an
emergency condition.
Panel B
interaction.
V there
is
No
no
(g) Calculate a 95 percent (individual) confidence interval for the mean time required to stabilize emergency condition 4
using display panel B. (Round your answers to 2 decimal places.)
Confidence
interval

Transcribed Image Text:A study compared three display panels used by air traffic controllers. Each display panel was tested for four different
simulated emergency conditions. Twenty-four highly trained air traffic controllers were used in the study. Two
controllers were randomly assigned to each display panel-emergency condition combination. The time (in seconds)
required to stabilize the emergency condition was recorded. The following table gives the resulting data and the JMP
output of a two-way ANOVA of the data.
Emergency
Condition
Display
Panel
1
25
24
22
19
31
34
28
31
32
37
14
13
6.
10
15
19
A
17
14
15
12
C
21 29
24
28
Least Squares Means Estimates
Panel Estimate Condition Estimate
21.500000
18.250000
25.625000
1
2
17.166667
24.500000
32.166667
13.333333
Analysis of Variance
Sum of
Squares
Mean
Square F Ratio
11 1482.4583 134.769 32.6713
Source DF
Model
Prob >
F
Error
12
49.5000
4.125
с.
Total
23 1531.9583
<.0001*
Effect Tests
Sum of
Source
Panel
Condition
Panel*
Condition
Nparm DF
2 2 218.5833
3 3 1247.4583
F Ratio Prob > F
26.4949 <.0001*
100.8047 <.0001*
Squares
6 6
16.4167
0.6633
0.6809
Tukey HSD All Pairwise Comparisons
Quantile = 2.66776, Adjusted DF = 12.0, Adjustment = Tukey
Panel
PanelDifference Std Error Batio Prob>[t|Lower 95% Upper 95%
A
B
3.25000 1.015505
-4.12500 1.015505 -4.06 0.0042*
3.20 0.0194*
0.5409
-6.8341 -1.41588
A
5.95912
C
-7.37500 1.015505 -7.26
-10.0841 -4.66588
.0001*
Tukey HSD All Pairwise Comparisons
Quantile = 2.9688, Adjusted DF = 12.0, Adjustment = Tukey
ConditionconditionDifference
Std
Error
t Ratio Prob> |t| Lower 95% Upper 95%
1
2.
-7.3333 1.172604 -6.25 0.0002* -10.8146
-3.8521
1
-15.0000 1.172604 -12.79
-18.4812 -11.5188
.0001*
3.27 0.0297*
1
4.
3.8333 1.172604
-7.6667 1.172604 -6.54 0.0001* -11.1479
0.3521
7.3146
-4. 1854
2
4
11.1667 1.172604
9.52
.0001*
7.6854
14.6479
3
4.
18.8333 1.172604
16.06
15.3521
22.3146
LPABC
Expert Solution
This question has been solved!
Explore an expertly crafted, step-by-step solution for a thorough understanding of key concepts.

This is a popular solution

Trending nowThis is a popular solution!

Step by stepSolved in 5 steps with 5 images

Knowledge Booster

Similar questions
- Assume a varies directly as b². If b is doubled, how will it affect a. Explain your answer in detail and upload your solution. Upload Choose a File Question 7 The mass of the sun is approximately 2 x 1030 kilograms, and the mass of the Earth is approximately 6 x 1024 kilograms. How many more times greater is the mass of the sun than the mass of the Earth? Explain your answer in detail and upload your solution. Upload Choose a File Question 8 JAN 14 MacBook Airarrow_forwardy= %3Darrow_forward
arrow_back_ios
arrow_forward_ios
Recommended textbooks for you
- MATLAB: An Introduction with ApplicationsStatisticsISBN:9781119256830Author:Amos GilatPublisher:John Wiley & Sons Inc
 Probability and Statistics for Engineering and th...StatisticsISBN:9781305251809Author:Jay L. DevorePublisher:Cengage Learning
 Statistics for The Behavioral Sciences (MindTap C...StatisticsISBN:9781305504912Author:Frederick J Gravetter, Larry B. WallnauPublisher:Cengage Learning
  Elementary Statistics: Picturing the World (7th E...StatisticsISBN:9780134683416Author:Ron Larson, Betsy FarberPublisher:PEARSON
 The Basic Practice of StatisticsStatisticsISBN:9781319042578Author:David S. Moore, William I. Notz, Michael A. FlignerPublisher:W. H. Freeman
 Introduction to the Practice of StatisticsStatisticsISBN:9781319013387Author:David S. Moore, George P. McCabe, Bruce A. CraigPublisher:W. H. Freeman
MATLAB: An Introduction with Applications
Statistics
ISBN:9781119256830
Author:Amos Gilat
Publisher:John Wiley & Sons Inc
Probability and Statistics for Engineering and th...
Statistics
ISBN:9781305251809
Author:Jay L. Devore
Publisher:Cengage Learning
Statistics for The Behavioral Sciences (MindTap C...
Statistics
ISBN:9781305504912
Author:Frederick J Gravetter, Larry B. Wallnau
Publisher:Cengage Learning
Elementary Statistics: Picturing the World (7th E...
Statistics
ISBN:9780134683416
Author:Ron Larson, Betsy Farber
Publisher:PEARSON
The Basic Practice of Statistics
Statistics
ISBN:9781319042578
Author:David S. Moore, William I. Notz, Michael A. Fligner
Publisher:W. H. Freeman
Introduction to the Practice of Statistics
Statistics
ISBN:9781319013387
Author:David S. Moore, George P. McCabe, Bruce A. Craig
Publisher:W. H. Freeman