MATLAB: An Introduction with Applications
6th Edition
ISBN: 9781119256830
Author: Amos Gilat
Publisher: John Wiley & Sons Inc
expand_more
expand_more
format_list_bulleted
Topic Video
Question

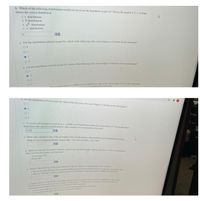
Transcribed Image Text:b. Which of the following distributions would you use to test the hypothesis in part ( Choose the munber 1,2,3, or 4 that
shows the cocect distribution
1t distribunon
2 F distribution
3X distribution
Va distribution
4.
For the distrbution selected in part (b), which of the following is the conect degrees of benle for the maneatw?
Fer the distribution selected in part (h whuch rhe lolwinge deges d d
02
11
a-0.025 leel of ficae whe
ccal
Uee
A Fohe d tn selacted n pan d), which of the fellowing a the cot deg of d ede
te w the ll odes ie pat)aa 0.025 level of gnlicaenwh is ecol of w
distrbuton table
value tondedo decl
f wicooey
t What is the calcatated valae ofibe tta ater
h vlur d e d of
(Note: To sa. nal e S 711l67
he
Based y
Ba I or 2so
Dot ejt
2 Meje
Whac the llaing will be
Wec clude d d
The is ie
erm e te matede
2. herw
b d e
C de

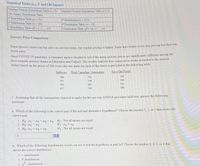
Transcribed Image Text:Statistical Tables (r, 4, F and Chi-Square)
Standard Normal Distributicn Table (2S0)
Standard Normal Distribution Table (220)
Chi-Square Distribution Table
FDistribution Table (a.01)
F Distribution Table (a-05)
t Distribution Table (d-1,2,35)
FDistribution (oa- 025)
FDistribution Table (a- 10)
1 Distribution Table (df-36, 37,0)
Grocery Price Comparison:
Some grocery stores run big sales on selected items, but regular pricing is higher. Some have better every-day pricing but then run
fewer sales
Amid COVID-19 pandemic, a consumer agency decided to test if the mean grocery prices are significantly different among ie
three popular grocery chains in Edmonton and Calgary The weekly total for four consecutive weeks (rounded to the nearest
dollar) based on the prices of 100 every-day use items for each of the stores is provided in the following table:
Safeway Real Canadian Superstore
Save On Foods
798
752
767
781
729
795
763
697
742
817
744
796
1. Assuming that all the assumptions required to apply for the one-way ANOVA procedure hold true, answer the following
questions
a. Which of the following is the correct pair of the null and alternative hypotheses? Choose the number 1, 2, or 3 that shows the
correct pair.
Ho: 41- 2 - 3-P4 H: Not all means are equal
2 Ho: 1- P2
3. Ho 1- 2 43
H: Not all means are equal
2
回助
b. Which of the following distributions would you use to test the hypothesis in part (a)? Choose the number 1, 2, 3, or 4 that
shows the corect distribution.
1t distribution
2 F distribution
distribution
Expert Solution
This question has been solved!
Explore an expertly crafted, step-by-step solution for a thorough understanding of key concepts.
Step by stepSolved in 2 steps with 1 images

Knowledge Booster
Learn more about
Need a deep-dive on the concept behind this application? Look no further. Learn more about this topic, statistics and related others by exploring similar questions and additional content below.Similar questions
- Recent research indicates that the effectiveness of antidepressant medication is directly related to the severity of the depression (Khan, Brodhead, Kolts & Brown, 2005). Based on pretreatment depression scores, patients were divided into four groups based on their level of depression. After receiving the antidepressant medication, depression scores were measured again and the amount of improvement was recorded for each patient. The following data are similar to the results of the study.Run the single-factor ANOVA for this data: LowModerate HighModerate ModeratelySevere Severe 3 2.7 3.4 4.6 2.1 1.6 3.6 3.5 2.4 2.4 2.8 3.1 1.8 2 3.1 2.5 2.2 2.2 3.4 3.4 0 2.3 4.7 3.1 Fill in the summary table for the ANOVA test: S.S. d.f. M.S. Between Within TOTAL From this table, obtain the necessary statistics for the ANOVA:F-ratio: p-value: η2= What is your final conclusion? Use a significance level of α=0.01. There is a significant…arrow_forwardWhat is the relative frequency? Give your answer to two decimal places.arrow_forwardSo far, Walter has scores of 18, 17, 19, and 21 points for the first four science quizzes. What does he need to score on the next quiz in order to achieve an average(mean) score of 20 points per quiz?arrow_forward
- Each year, marketing and information firm J.D. Power and Associates surveys new car owners 90 days after they have purchased their cars. The data collected are used to rate auto brands (Toyota, Ford, and others) on initial quality and initial customer satisfaction. USA Today reported both the number of manufacturing defects per 100 vehicles and a satisfaction score for all 33 brands sold in the United States.+ A research group decides to compare the mean number of defects for 2 specific models of cars, A and B, made this year by taking random samples of 100 cars of each model. USE SALT (a) After collecting the data, the research group calculates a 95% confidence interval to estimate the difference in population means. In this case, what is the population? O the defects O all cars made this year all cars for models A and B that were produced this year O the 100 cars from each model (b) Suppose the calculated confidence interval is (100, 104) number of defects. What is the value of the…arrow_forwardIndicate the dependent and independent variables, the number of levels for each independent variable, and whether each variable is within-subjects or between subjects 1. Individuals with anorexia and individuals with bulimia take a cognitive distortions test upon entering a treatment program for eating disorders and again three weeks later.arrow_forwardA preschool teacher is interested in whether the type of math program used impacts learning. One class receives a workbook to complete at home and another class receives an interactive app. The preschool teacher then compares whether those who received the interactive app versus the workbook perform better on a math test (percentage correct). Identify the independent variable and the operational definition Identify the dependent variable and the operational definition. Below you will find data for this experiment. Draw a histogram for each of the math programs. Determine if the data for each condition presents any skewness or kurtosis properties. Compute the following for each condition below: ∑X ∑(X)2 ∑X2 ∑(X-1) ∑(X-1)2 Workbook X f 80 2 79 2 75 3 81 1 60 5 65 6 75 8 App X f 90 5 80 3 82 4 94 3 78 2 93 4 92 6arrow_forward
- In a data set with 25 scores, if the value 16 occurs 12 times, what is its relative frequency?arrow_forwardAn observational study of teams fishing for the red spiny lobster in a certain body of water was conducted and the results published in a science magazine. One of the variables of interest was the average distance separating traps - called "trap spacing" - deployed by the same team of fishermen. Trap spacing measurements (in meters) for a sample of seven teams of fishermen are shown in the accompanying table. Of interest is the mean trap spacing for the population of red spiny lobster fishermen fishing in this body of water. Complete parts a through f below. E Click the icon to view the trap spacing data. Trap Spacing Data a. Identify the target parameter for this study. The target parameter for this study is 93 101 107 95 81 68 84 b. Compute a point estimate of the target parameter. (Round to two decimal places as needed.) Print Done c. What is the problem with using the normal (z) statistic to finda confidence interval for the target parameter? O A. The point estimate is too large to…arrow_forwardA researcher is studying psychological factors in artistic achievement among teenage girls. One variable he is particularly interested in is perseverance. What information does a measure of variability for the variable perseverance convey? Check all that apply. What is the central tendency for the variable perseverance among teenage girls? What is the most common value for the variable perseverance among teenage girls? How spread out are the values for perseverance amoung teenage girls? Do all teenage girls have the same amount of perseverance?arrow_forward
arrow_back_ios
arrow_forward_ios
Recommended textbooks for you
 MATLAB: An Introduction with ApplicationsStatisticsISBN:9781119256830Author:Amos GilatPublisher:John Wiley & Sons Inc
 Probability and Statistics for Engineering and th...StatisticsISBN:9781305251809Author:Jay L. DevorePublisher:Cengage Learning
 Statistics for The Behavioral Sciences (MindTap C...StatisticsISBN:9781305504912Author:Frederick J Gravetter, Larry B. WallnauPublisher:Cengage Learning
 Elementary Statistics: Picturing the World (7th E...StatisticsISBN:9780134683416Author:Ron Larson, Betsy FarberPublisher:PEARSON
 The Basic Practice of StatisticsStatisticsISBN:9781319042578Author:David S. Moore, William I. Notz, Michael A. FlignerPublisher:W. H. Freeman
 Introduction to the Practice of StatisticsStatisticsISBN:9781319013387Author:David S. Moore, George P. McCabe, Bruce A. CraigPublisher:W. H. Freeman

MATLAB: An Introduction with Applications
Statistics
ISBN:9781119256830
Author:Amos Gilat
Publisher:John Wiley & Sons Inc

Probability and Statistics for Engineering and th...
Statistics
ISBN:9781305251809
Author:Jay L. Devore
Publisher:Cengage Learning

Statistics for The Behavioral Sciences (MindTap C...
Statistics
ISBN:9781305504912
Author:Frederick J Gravetter, Larry B. Wallnau
Publisher:Cengage Learning

Elementary Statistics: Picturing the World (7th E...
Statistics
ISBN:9780134683416
Author:Ron Larson, Betsy Farber
Publisher:PEARSON

The Basic Practice of Statistics
Statistics
ISBN:9781319042578
Author:David S. Moore, William I. Notz, Michael A. Fligner
Publisher:W. H. Freeman

Introduction to the Practice of Statistics
Statistics
ISBN:9781319013387
Author:David S. Moore, George P. McCabe, Bruce A. Craig
Publisher:W. H. Freeman