
MATLAB: An Introduction with Applications
6th Edition
ISBN: 9781119256830
Author: Amos Gilat
Publisher: John Wiley & Sons Inc
expand_more
expand_more
format_list_bulleted
Related questions
Question
If appropriate, construct a 95% confidence interval for the mean price for all phones of this type being sold on the Internet in 2013. Round your intermediate step to three decimal places. Round your answer to one decimal place.
ANSWER PART 3
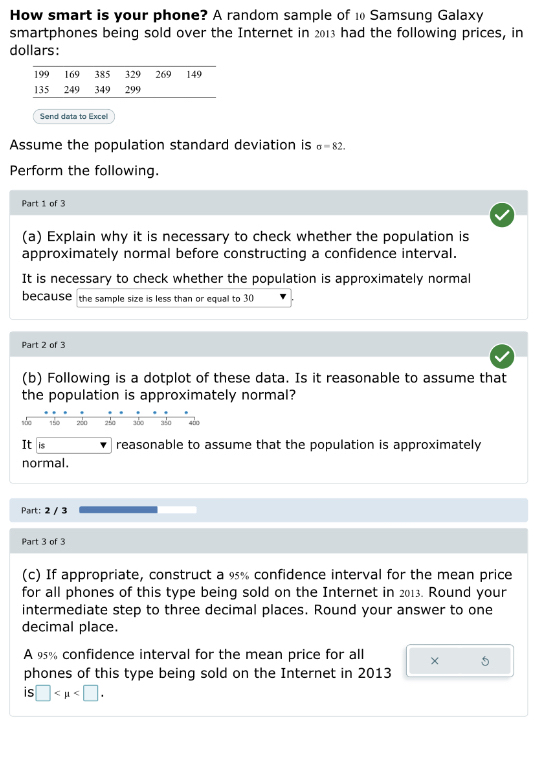

Transcribed Image Text:How smart is your phone? A random sample of 10 Samsung Galaxy
smartphones being sold over the Internet in 2013 had the following prices, in
dollars:
199 169 385 329 269 149
135 249 349 299
Send data to Excel
Assume the population standard deviation is a-82.
Perform the following.
Part 1 of 3
(a) Explain why it is necessary to check whether the population is
approximately normal before constructing a confidence interval.
It is necessary to check whether the population is approximately normal
because the sample size is less than or equal to 30
Part 2 of 3
(b) Following is a dotplot of these data. Is it reasonable to assume that
the population is approximately normal?
100 150
It is
normal.
Part: 2/3
Part 3 of 3
200 250 300 350
reasonable to assume that the population is approximately
(c) If appropriate, construct a 95% confidence interval for the mean price
for all phones of this type being sold on the Internet in 2013. Round your
intermediate step to three decimal places. Round your answer to one
decimal place.
A 95% confidence interval for the mean price for all
phones of this type being sold on the Internet in 2013
is<μ<.
Expert Solution
This question has been solved!
Explore an expertly crafted, step-by-step solution for a thorough understanding of key concepts.

This is a popular solution

Trending nowThis is a popular solution!

Step by stepSolved in 3 steps with 13 images

Knowledge Booster

Similar questions
- ACT scores overall have a mean of 1017 and s = 207. If a college wants to admit only the top 30% of those, what score would they use as the minimum required? (Round to the appropriate whole number score). They would admit scores of and above.arrow_forwardJason scored a 83 out of 100 Sarah scored a 80 out of 100 Sam scored a 75 out of 100 What is the percentile rank.arrow_forwardA recent study evaluated how addicted teenagers become to nicotine once they start smoking. The response variable was the number of yes answers on a questionnaire called the Hooked on Nicotine Checklist (HONC). Of teenagers who had tried tobacco, the mean HONC score was 4.2 (s = 5.4) for the 149 females and 2.8 (s=4.2) for the 190 males. Complete parts a through c below. 000 DOD F4 What does the standard error indicate? A. The standard error describes the spread of the sampling distribution of x₁ - x₂. B. The standard error is the standard deviation of the difference between x₁ - x₂. OC. The standard error is the standard deviation of the sample for this study. OD. The standard error is the difference in standard deviations for the two populations. ... b. Find the test statistic and P-value for Ho: H₁ H₂ and Ha: H₁ H₂. Interpret, and explain what (if any) effect gender has on the mean HONC score. Use the significance level 0.05. The test statistic is (Round to two decimal places as…arrow_forward
arrow_back_ios
arrow_forward_ios
Recommended textbooks for you
- MATLAB: An Introduction with ApplicationsStatisticsISBN:9781119256830Author:Amos GilatPublisher:John Wiley & Sons Inc
 Probability and Statistics for Engineering and th...StatisticsISBN:9781305251809Author:Jay L. DevorePublisher:Cengage Learning
 Statistics for The Behavioral Sciences (MindTap C...StatisticsISBN:9781305504912Author:Frederick J Gravetter, Larry B. WallnauPublisher:Cengage Learning
  Elementary Statistics: Picturing the World (7th E...StatisticsISBN:9780134683416Author:Ron Larson, Betsy FarberPublisher:PEARSON
 The Basic Practice of StatisticsStatisticsISBN:9781319042578Author:David S. Moore, William I. Notz, Michael A. FlignerPublisher:W. H. Freeman
 Introduction to the Practice of StatisticsStatisticsISBN:9781319013387Author:David S. Moore, George P. McCabe, Bruce A. CraigPublisher:W. H. Freeman
MATLAB: An Introduction with Applications
Statistics
ISBN:9781119256830
Author:Amos Gilat
Publisher:John Wiley & Sons Inc
Probability and Statistics for Engineering and th...
Statistics
ISBN:9781305251809
Author:Jay L. Devore
Publisher:Cengage Learning
Statistics for The Behavioral Sciences (MindTap C...
Statistics
ISBN:9781305504912
Author:Frederick J Gravetter, Larry B. Wallnau
Publisher:Cengage Learning
Elementary Statistics: Picturing the World (7th E...
Statistics
ISBN:9780134683416
Author:Ron Larson, Betsy Farber
Publisher:PEARSON
The Basic Practice of Statistics
Statistics
ISBN:9781319042578
Author:David S. Moore, William I. Notz, Michael A. Fligner
Publisher:W. H. Freeman
Introduction to the Practice of Statistics
Statistics
ISBN:9781319013387
Author:David S. Moore, George P. McCabe, Bruce A. Craig
Publisher:W. H. Freeman