
Essentials Of Investments
11th Edition
ISBN: 9781260013924
Author: Bodie, Zvi, Kane, Alex, MARCUS, Alan J.
Publisher: Mcgraw-hill Education,
expand_more
expand_more
format_list_bulleted
Related questions
Question

Transcribed Image Text:C (Ib/gal) -
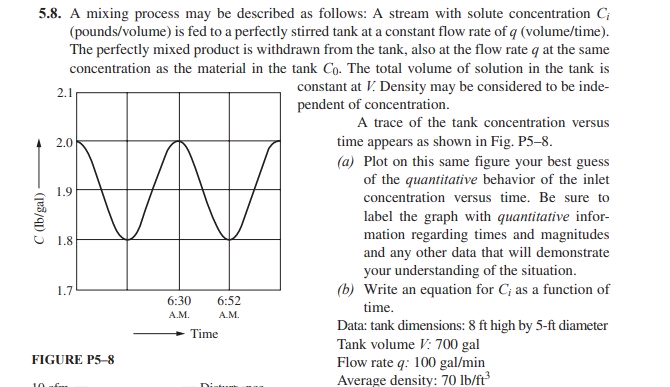
5.8. A mixing process may be described as follows: A stream with solute concentration Ci
(pounds/volume) is fed to a perfectly stirred tank at a constant flow rate of q (volume/time).
The perfectly mixed product is withdrawn from the tank, also at the flow rate q at the same
concentration as the material in the tank Co. The total volume of solution in the tank is
constant at V. Density may be considered to be inde-
2.1
2.0
1.9
1.8
1.7
W
FIGURE P5-8
10
6:30
A.M.
Time
6:52
A.M.
pendent of concentration.
A trace of the tank concentration versus
time appears as shown in Fig. P5-8.
(a) Plot on this same figure your best guess
of the quantitative behavior of the inlet
concentration versus time. Be sure to
label the graph with quantitative infor-
mation regarding times and magnitudes
and any other data that will demonstrate
your understanding of the situation.
(b) Write an equation for C; as a function of
time.
Data: tank dimensions: 8 ft high by 5-ft diameter
Tank volume V: 700 gal
Flow rate q: 100 gal/min
Average density: 70 lb/ft³
Expert Solution
This question has been solved!
Explore an expertly crafted, step-by-step solution for a thorough understanding of key concepts.

Step by stepSolved in 2 steps with 9 images

Knowledge Booster

Similar questions
- The figure below shows two unknown devices, each of which separates (disperses) white light into its spectrum. The positions of the two wavelengths are shown on each screen. Two optical devices that can produce cases A and B (respectively) are Case A ? Case B ? 2.700 nm 2400 nm 2400 nm 2.700 nm OA. a concave mirror and a convex lens B. a ray box and a prism C. a transmission grating and a prism OD. a transmission grating and a ray boxarrow_forwardExplain an example how to calculate acid test ratio.arrow_forwardWhat is the Riemannian metric? A) A function that defines the inner product of tangent vectors at each point on a manifold B) A function that measures the curvature of a surface C) A function that defines the volume of a manifold D) A function that determines the Euler characteristic of a manifoldarrow_forward
- Crex Co was set up by Cynthia Rex who created her own brand of chalk paint 20 years ago. Using her background in fine art, she developed this specialist chalk paint to be used in the restoration of furniture and to decorate accessories. The chalk paints are exclusively available through Crex Co's network of over 800 independent stockists who are located in over 30 countries around the world. The manufacturing process begins with the three chemicals required for the paint being measured on electronic scales. A worker then takes the chemicals and places them into a machine for mixing. Once mixed the worker removes the mixture from the machine and transfers it to tin containers. The standard material costs per litre of chalk paint are as follows: Litres required $ per litre 0.80 1.20 0.15 1.40 0.10 0.80 1.05 Material Latex paint Plaster of Paris Calcium carbonate At the end of the last period, actual output of the chalk paint was 3,325 litres and actual data relating to this production…arrow_forwardPerfect Pet Collar Company makes custom leather pet collars. The company expects each collar to require 2.35 feet of leather and predicts leather will cost $4.20 per foot. Suppose Perfect Ret made 85 collars during February. For these 85 collars, the company actually averaged 2.50 feet of leather per collar and paid $3.80 per foot. Required: 1. Calculate the standard direct materials cost per unit. 2. Without performing any calculations, determine whether the direct materials price variance will be favorable or unfavorable. 3. Without performing any calculations, determine whether the direct materials quantity variance will be favorable or unfavorable. 6. Calculate the direct materials price and quantity variances. Complete this question by entering your answers in the tabs below. Req 1 Req 2 and 3 Req 6 Calculate the standard direct materials cost per unit. Note: Round your answer to 2 decimal places. Standard Direct Materials per Collar Reg 2 and 3>arrow_forwardTUTOR Analysis of a Weak Acid-Strong Base Titration Curve Determine the pH during the titration of 58.1 mL of 0.387 M hydrocyanic acid (Ka = 4.0×10-10) by 0.387 M NaOH at the following points. (Assume the titration is done at 25 °C.) pt pt pt pt (b) After the addition of 14.0 mL of NaOH pt (a) Before the addition of any NaOH (c) At the half-equivalence point (the titration midpoint) (d) At the equivalence point (e) After the addition of 87.2 mL of NaOH Submit Show Approach Show Tutor Steps Submit Answer Try Another Version 1 item attempt remainingarrow_forward
arrow_back_ios
arrow_forward_ios
Recommended textbooks for you
- Essentials Of InvestmentsFinanceISBN:9781260013924Author:Bodie, Zvi, Kane, Alex, MARCUS, Alan J.Publisher:Mcgraw-hill Education,


 Foundations Of FinanceFinanceISBN:9780134897264Author:KEOWN, Arthur J., Martin, John D., PETTY, J. WilliamPublisher:Pearson,
 Fundamentals of Financial Management (MindTap Cou...FinanceISBN:9781337395250Author:Eugene F. Brigham, Joel F. HoustonPublisher:Cengage Learning
 Corporate Finance (The Mcgraw-hill/Irwin Series i...FinanceISBN:9780077861759Author:Stephen A. Ross Franco Modigliani Professor of Financial Economics Professor, Randolph W Westerfield Robert R. Dockson Deans Chair in Bus. Admin., Jeffrey Jaffe, Bradford D Jordan ProfessorPublisher:McGraw-Hill Education
Essentials Of Investments
Finance
ISBN:9781260013924
Author:Bodie, Zvi, Kane, Alex, MARCUS, Alan J.
Publisher:Mcgraw-hill Education,
Foundations Of Finance
Finance
ISBN:9780134897264
Author:KEOWN, Arthur J., Martin, John D., PETTY, J. William
Publisher:Pearson,
Fundamentals of Financial Management (MindTap Cou...
Finance
ISBN:9781337395250
Author:Eugene F. Brigham, Joel F. Houston
Publisher:Cengage Learning
Corporate Finance (The Mcgraw-hill/Irwin Series i...
Finance
ISBN:9780077861759
Author:Stephen A. Ross Franco Modigliani Professor of Financial Economics Professor, Randolph W Westerfield Robert R. Dockson Deans Chair in Bus. Admin., Jeffrey Jaffe, Bradford D Jordan Professor
Publisher:McGraw-Hill Education